Summary
- Markets formally on inversion watch
- The long-end of the curve has started to come in as traders see slower growth, lower inflationary pressure
- The short-end of the curve is rising; we've seen some modest inversions in the belly of the curve this past week
What is the inversion of the yield curve and why is it so important? To answer that, let's look at the dynamics of the yield curve in relation to the economic cycle, starting at the beginning of an expansion.
Here, the Fed has lowered rates with the intent to stimulate economic activity. At the same time, there is little growth and, hence, little inflation, which means long-term bond yields are high. This explains why the yield curve is very steep at the beginning of an expansion.
About 1/2-2/3 of the way through an expansion, central bankers start to become concerned about inflation, reasoning that increased economic activity will constrain resources and push up prices. To prevent this, they start to raise short-term interest rates.
Sometimes the long-end of the curve will sell off, fearing the potential inflationary bite. This keeps the curve's overall steepness more or less constant for a while. But at some point the long-end of the curve will start to tighten as traders sense slowing economic growth. This occurs while the Fed is probably at the tail-end of its rate-hiking program. The following long-term graph shows the dynamic in action: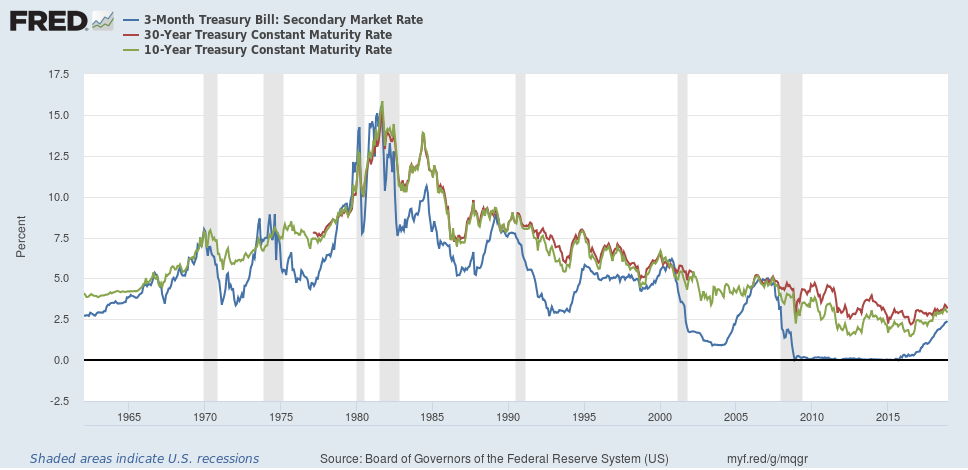
The blue line is the 3-month Treasury bill. Notice that it almost always has the most movement relative to the long-end of the curve and is most responsible for the curve flattening and then inverting.
Now, let's turn to the current yield curve to show this dynamic in real-time action.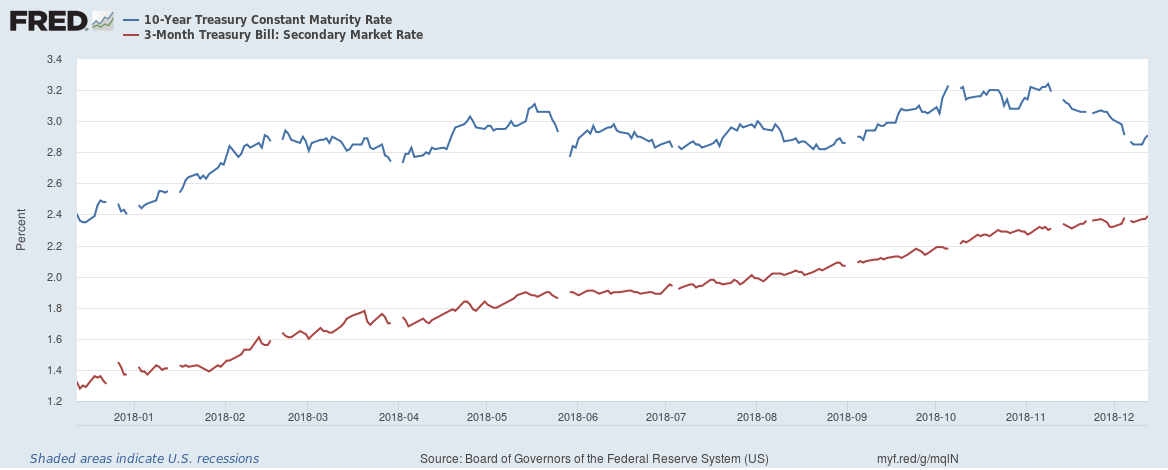
The 10-year Treasury has traded between 2.8% and 3.2% since April of 2018. At the same time, the 30-year Treasury has risen from a little below 1.4% to 2.4% - a rise of slightly more than 100 basis points. Here is the 10-3 spread: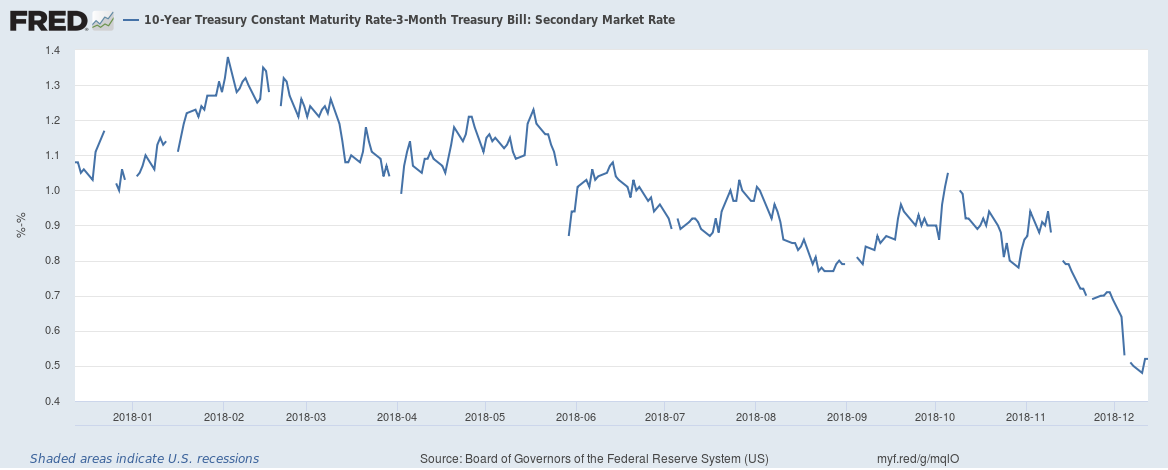
It's on a clear downward path, falling from slightly below 140 basis points to its current level around 50 basis points.
Next, let's look at a smaller section of the curve - the 2-year and 5-year spread, starting with a table of yields from the U.S. Treasury Department's website:
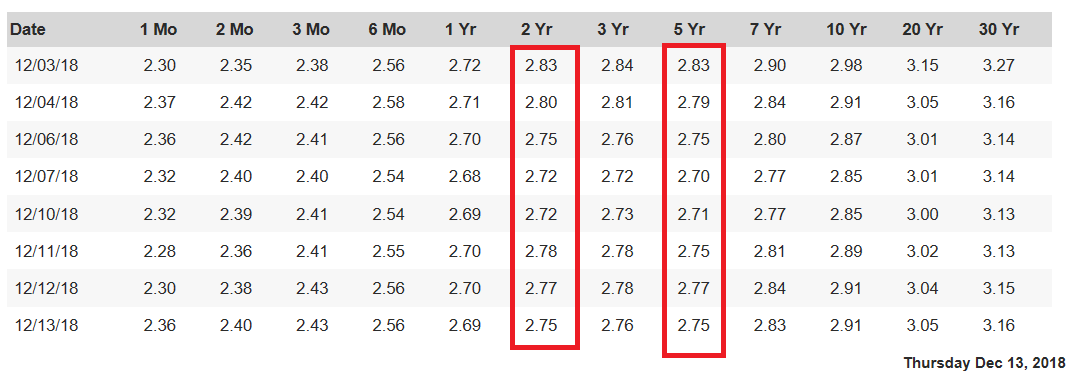
The 2-year rate has been a few basis points about the 5-year this week. And the 2-year is very close to the 7-year. Here is a graphical depiction:
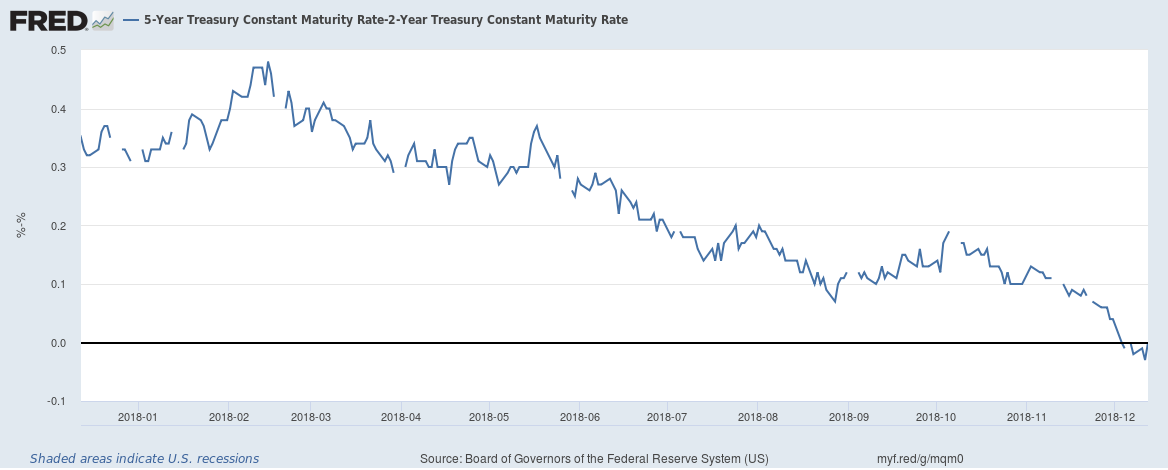
The 5-2 spread fell below 0 last week. And...
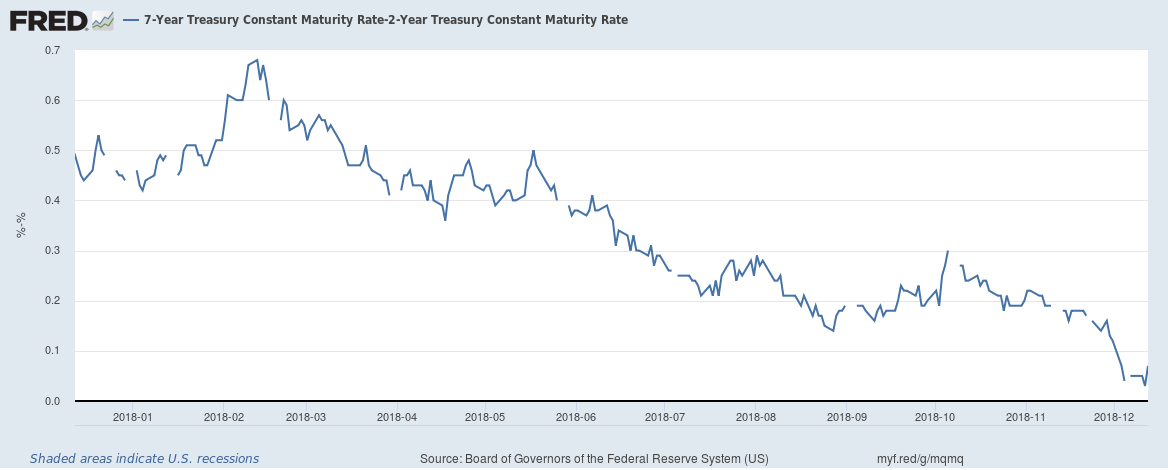
...the 7-2 spread is approaching 0.
In addition, the long-end of the curve has started to tighten: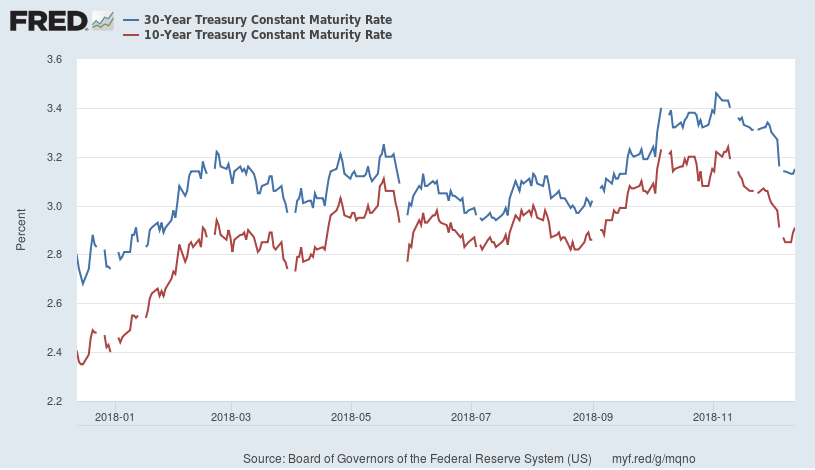
It looks like the 10-year CMT hit a yearly peak of slightly more than 3.2% at the beginning of November; the 30-year reached a yearly high around the same time at slightly more than 3.4%. Since then, both are down more than 20 basis points.
Let's wrap all this up. The short-end of the curve started to rally at the end of 2015 as the Fed started to increase rates. This trend has continued; the short-end of the curve (the 3-month Treasury) is trading around 2.4%. At the same time, the long-end of the curve appears to have peaked for now and is coming in, tightening the curve. We're also starting to see small inversions occurring in the belly of the curve. All of this is playing out in a standard, pre-recession script.
Disclosure: I/we have no positions in any stocks mentioned, and no plans to initiate any positions within the next 72 hours. I have no business relationship with any company whose stock is mentioned in this article.
