According to the chief U.S. market strategist at RBC Capital Markets, Jonathan Golub, seven of the last eight bull markets ended at the onset of a recession. There are several problems with this assertion. First, it represents an ethnocentric “read” that ignores the interconnected nature of the global economy. Slowdowns in the respective economies of China, India and Brazil did not meet criteria normally associated with recessions; nevertheless, deceleration in each country’s gross domestic output occurred alongside brutal stock market bears.
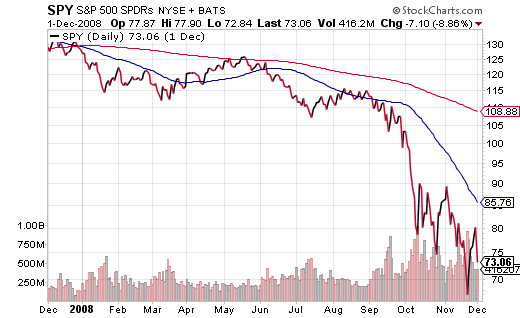
Another significant problem with the statement is the idea that the “onset” of the recession might somehow be determined beforehand. The National Bureau of Economic Research (NBER) did not determine that the last recession’s beginning had occurred in December of 2007 until December of 2008. Investor’s Business Daily asked my opinion in January of 2008 about the probability of a recession in the year ahead (2008), and while I indicated that there was an 80% likelihood, I did not claim that the recession had already started. By the time the powers-that-be had officially declared the recession’s onset – one year after the fact – the SPDR S&P 500 Trust(ARCA:SPY) had already collapsed.
In truth, it is the fear of “bad times” that causes stocks to sink, and the depth of the setback is typically related to the intensity of the emotions. Anxiety, angst and apprehension? We may see stocks “correct” five to nine percentage points. Trepidation, tension and distress? A sell-off may meet with a decline in a range of 10%-19%. Panic, hysteria, horror? A stampeding for the exits may send stocks down 20%, 35%, 50% or 65%.
It would be nice to think that there are a few brilliant souls with the power to discern when a hiccup will morph into something terribly tragic, whether the tragedy relates to an economy or a stock market or both. Yet there’s a goat for every guru (and every guru has been or will be a goat).
There are, however, a fair number of indicators that are worthy of monitoring. For example, when the American Association of Individual Investor (AAII) Survey of bearishness or bullishness hits an extreme in either direction, moving in the opposite direction of the herd can be quite rewarding. Bearish sentiment hit a record peak of 70.3% on March 5, 2009, near the point at which the previous bear market had hit rock bottom. Conversely, if the AAII Survey registers a record level of complacency, you might want to play “Seattle Seahawk” defense.
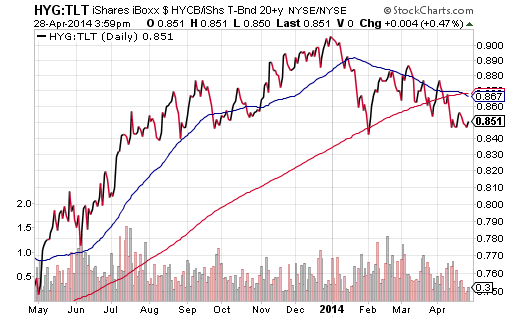
An unbiased indicator that I have been keeping an eye on is the price ratio for the relationship between junk bonds via the iShares High Yield Bond ETF (ARCA:HYG) and long Treasuries via the iShares 20+ Treasury fund (ARCA:TLT). When demand for risk is rising, the HYG:TLT price ratio rises. Conversely, when there is a premium for safety-seeking in longer-term U.S. Treasuries, the HYG:TLT price ratio dips.
There are two ominous technical patterns worth mentioning here. The shorter-term (50-day) trendline is crossing below the longer-term (200-day) moving average. Second, the current reading for the HYG:TLT price ratio is well below its longer-term (200-day) moving average for the first time in more than a year. Both occurrences may be indicating less willingness to risk capital in the months ahead.
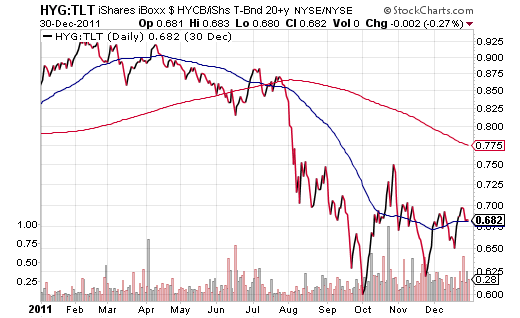
Do the debt markets really tell us anything about what stock investors are doing let alone the possibility of an economic slowdown? Probably not. But they do tell us something about fear and greed. In fact, the HYG:TLT price ratio flashed warning signals prior to the eurozone crisis that led to an 18%-25% dip for U.S. stocks and 30%-40% unrealized losses for foreign stocks in 2011.
At this moment, the reward for adding more money to U.S. equities appears to be increasingly risky. The S&P 500 has not experienced a 10% pullback in more than 30 months. And risk-off Treasury Bond ETFs are defying the call for higher interest rates.
If you are dollar cost averaging into stock ETF positions with new money, favor those positions that provide a degree of shelter from potential storms. Consider dividends from a fund like First Trust Technology Dividend (TDIV.O) and/or low volatility equities from a fund like iShares USA Minimum Volatility (USMV.K).
Disclosure: Gary Gordon, MS, CFP is the president of Pacific Park Financial, Inc., a Registered Investment Adviser with the SEC. Gary Gordon, Pacific Park Financial, Inc, and/or its clients may hold positions in the ETFs, mutual funds, and/or any investment asset mentioned above. The commentary does not constitute individualized investment advice. The opinions offered herein are not personalized recommendations to buy, sell or hold securities. At times, issuers of exchange-traded products compensate Pacific Park Financial, Inc. or its subsidiaries for advertising at the ETF Expert web site. ETF Expert content is created independently of any advertising relationships.


