Article Summary: It’s shaping up to be another critical week for forex price action and we believe buying US Dollar dips remains attractive.
DailyFX PLUS System Trading Signals -- To briefly summarize our pro-US Dollar trading bias: the Bond Bubble burst threatens to force volatility higher across the board, and we believe that the Dollar remains attractive amidst the potential for broader market distress.
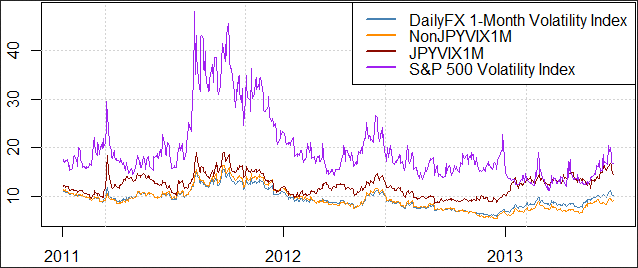
FX volatility prices reflect those fears: traders are paying the most for currency options since mid-2012. Yet the chart below shows that the S&P 500 Volatility Index (VIX) hasn’t even hit its highest since last year, while our DailyFX one-Month Volatility Index is similarly below 2012 peaks. In other words: things could get far worse before they get better.

Source: OTC FX Options Prices, CBOE Data from Bloomberg; DailyFX Calculations
Past performance is not indicative of future results, but our sentiment-based trading strategies have done well in highly-volatile markets. That said, our go-to breakout trading strategy (Breakout2) has not taken advantage of recent moves because its sentiment filter has kept it out of key US Dollar-long positions.
Our major focus remains the Momentum2 strategy -- also known as the “Tidal Shift” system. The system has done well in getting long the USD on a number of occasions now, and its trading logic leaves it in a good position to continue doing the same.
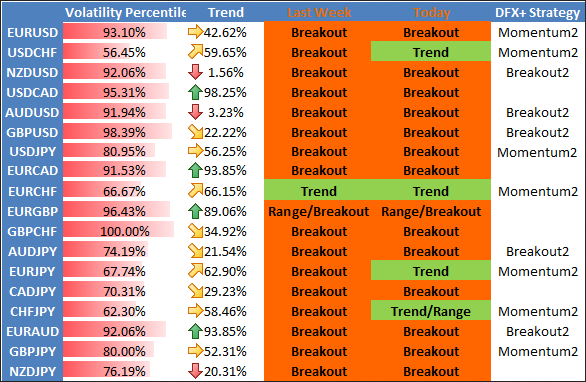
View the table below to see our strategy preferences broken down by currency pair. You can likewise view a more in-depth discussion of strategy biases via this week’s archived Strategy webinar.
This table is updated every Monday morning and, if market conditions warrant, throughout the week.

by David Rodriguez, Quantitative Strategist for DailyFX.com.
Definitions
Volatility Percentile – The higher the number, the more likely we are to see strong movements in price. This number tells us where current implied volatility levels stand in relation to the past 90 days of trading. We have found that implied volatilities tend to remain very high or very low for extended periods of time. As such, it is helpful to know where the current implied volatility level stands in relation to its medium-term range.
Trend – This indicator measures trend intensity by telling us where price stands in relation to its 90 trading-day range. A very low number tells us that price is currently at or near 90-day lows, while a higher number tells us that we are near the highs. A value at or near 50 percent tells us that we are at the middle of the currency pair’s 90-day range.
Range High – 90-day closing high.
Range Low – 90-day closing low.
Last – Current market price.
Bias – Based on the above criteria, we assign the more likely profitable strategy for any given currency pair. A highly volatile currency pair (Volatility Percentile very high) suggests that we should look to use Breakout strategies. More moderate volatility levels and strong Trend values make Momentum trades more attractive, while the lowest Vol Percentile and Trend indicator figures make Range Trading the more attractive strategy.
DailyFX PLUS System Trading Signals -- To briefly summarize our pro-US Dollar trading bias: the Bond Bubble burst threatens to force volatility higher across the board, and we believe that the Dollar remains attractive amidst the potential for broader market distress.
FX volatility prices reflect those fears: traders are paying the most for currency options since mid-2012. Yet the chart below shows that the S&P 500 Volatility Index (VIX) hasn’t even hit its highest since last year, while our DailyFX one-Month Volatility Index is similarly below 2012 peaks. In other words: things could get far worse before they get better.

Source: OTC FX Options Prices, CBOE Data from Bloomberg; DailyFX Calculations
Past performance is not indicative of future results, but our sentiment-based trading strategies have done well in highly-volatile markets. That said, our go-to breakout trading strategy (Breakout2) has not taken advantage of recent moves because its sentiment filter has kept it out of key US Dollar-long positions.
Our major focus remains the Momentum2 strategy -- also known as the “Tidal Shift” system. The system has done well in getting long the USD on a number of occasions now, and its trading logic leaves it in a good position to continue doing the same.
View the table below to see our strategy preferences broken down by currency pair. You can likewise view a more in-depth discussion of strategy biases via this week’s archived Strategy webinar.
This table is updated every Monday morning and, if market conditions warrant, throughout the week.

by David Rodriguez, Quantitative Strategist for DailyFX.com.
Definitions
Volatility Percentile – The higher the number, the more likely we are to see strong movements in price. This number tells us where current implied volatility levels stand in relation to the past 90 days of trading. We have found that implied volatilities tend to remain very high or very low for extended periods of time. As such, it is helpful to know where the current implied volatility level stands in relation to its medium-term range.
Trend – This indicator measures trend intensity by telling us where price stands in relation to its 90 trading-day range. A very low number tells us that price is currently at or near 90-day lows, while a higher number tells us that we are near the highs. A value at or near 50 percent tells us that we are at the middle of the currency pair’s 90-day range.
Range High – 90-day closing high.
Range Low – 90-day closing low.
Last – Current market price.
Bias – Based on the above criteria, we assign the more likely profitable strategy for any given currency pair. A highly volatile currency pair (Volatility Percentile very high) suggests that we should look to use Breakout strategies. More moderate volatility levels and strong Trend values make Momentum trades more attractive, while the lowest Vol Percentile and Trend indicator figures make Range Trading the more attractive strategy.
