Treasury Bonds have been like a cat with 9 lives. Maybe even more than 9 lives. Every time you think the end of a 30 plus year uptrend in prices is about to end, they befuddle and reverse. Will that happen again?
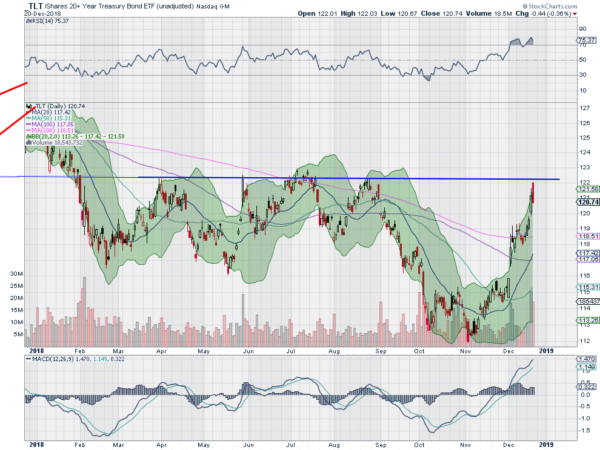
The chart below shows the price of the US Treasury Bond ETF over the past year. There are a couple of key points to look at in this chart. First is the resistance line cutting across the chart. Four times prior to this week the price has stalled and reversed as it hit this price level. Thursday it probed near it and had a hard reversal again. Is that the end of the rally?

The second is the price relative to the 200 day SMA. The pink line has held prices in check every time they have touched it over the past year. But that changed this week. Was the break a change of character or a fluke? Time will tell.
These two price points will define Treasury prices in the near term. When prices finally leave one of them in the dust we may then know a trend is starting. Until then they sideways action of 2018 remains in control.
The information in this blog post represents my own opinions and does not contain a recommendation for any particular security or investment. I or my affiliates may hold positions or other interests in securities mentioned in the Blog, please see my Disclaimer page for my full disclaimer.
