Boeing Woes May Not Be Over Despite Management Change

Published 12/24/2019, 12:28 AM

Medium-term technical outlook on Boeing (NYSE:BA)
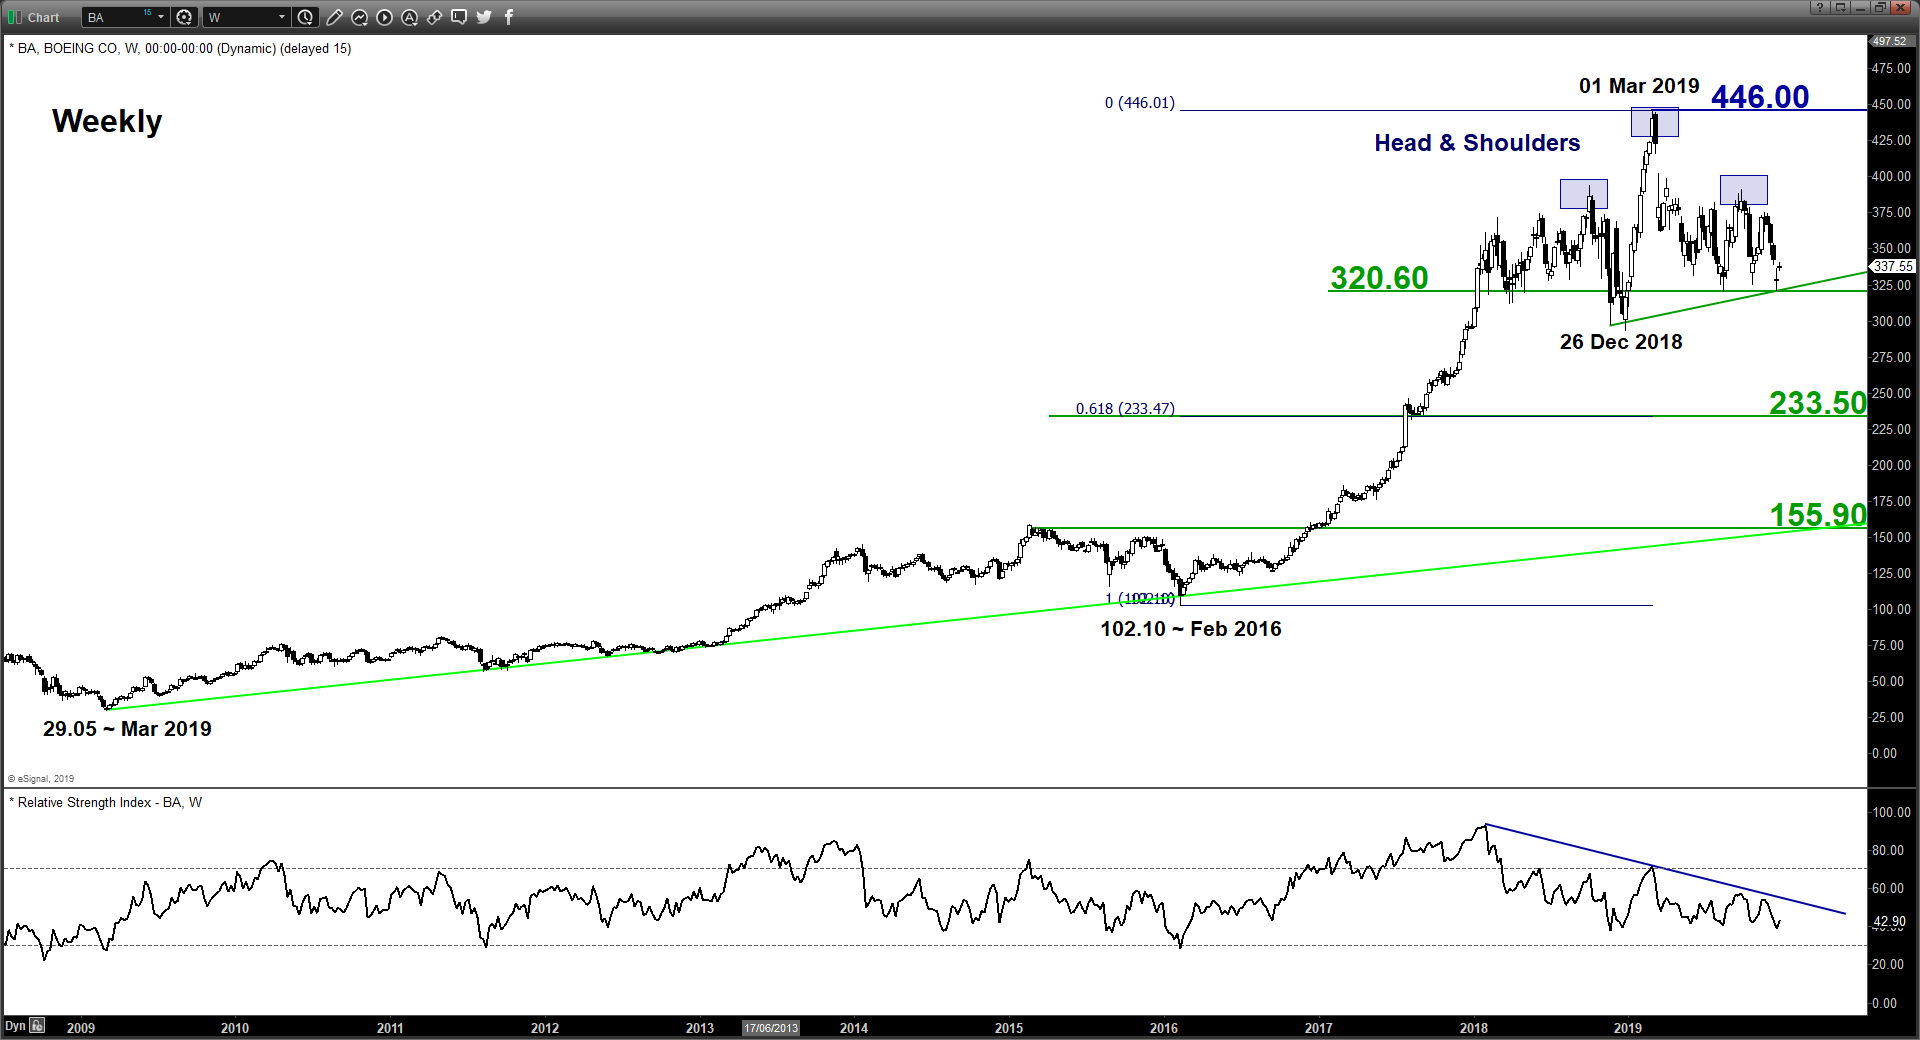
Boeing Weekly Chart
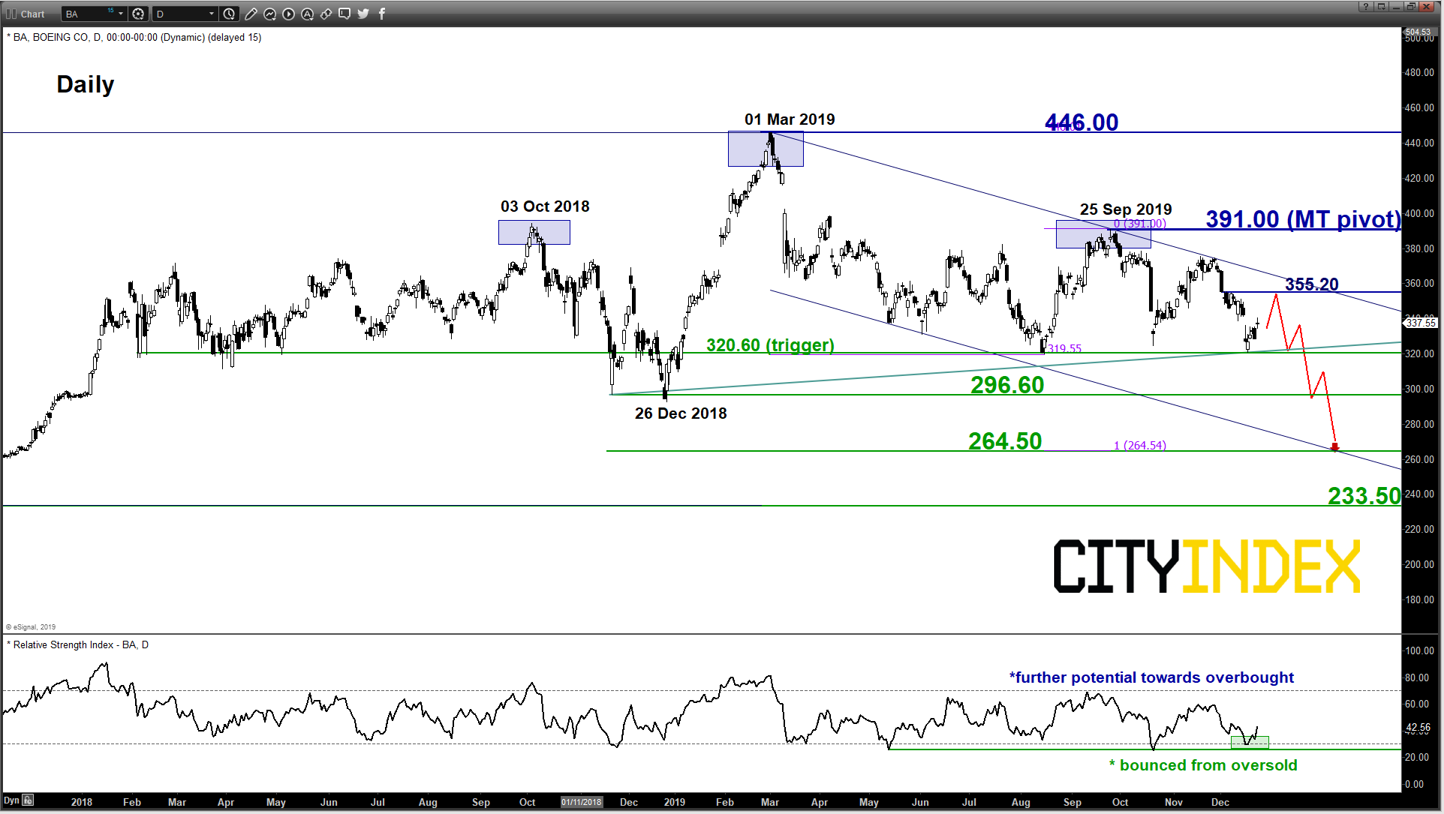
Boeing Daily Chart

Key Levels (1 to 3 months)

Intermediate resistance: 355.20

Pivot (key resistance): 391.00

Supports: 320.60, 296.60 & 264.50

Next resistance: 446.00

Directional Bias (1 to 3 months)

The share price of Boeing rallied by 2.91% yesterday, with the sudden resignation of CEO Dennis Muilenburg after four weeks of consecutive decline of 14%, driven by the fallout from its 737 MAX crisis and the recent failed space travel mission on its unmanned Starliner capsule. Safety lapses in the 737 MAX model had led to fatal crashes in 2018 and 2019 and left Boeing (NYSE:BA) in the centre of regulatory and public scrutiny. Chief Financial Officer Greg Smith will serve as interim CEO until Chairman David Calhoun takes over as CEO effective Jan. 13, 2020.

However, technical analysis on the share price of Boeing is not advocating for a bullish “Bottoming” phase at this juncture.

Bearish bias in any bounces below 391.00 key medium-term pivotal resistance and a break with a daily close below 320.60 reinforces the start of a potential multi-week corrective decline sequence to target the next supports at 296.60 and 264.50.

On the other hand, a clearance with a daily close above 391.00 invalidates the bearish scenario for a push up to retest the current all-time high level of 446.00.

Key elements

  • Since its 446.01 all-time high printed on 01 Mar 2019, Boeing has traced out a major bearish topping configuration, “Head & Shoulders” after a stellar up move of 335% from its February 2016 swing low of 102.10.

  • The neckline support of “Head & Shoulders” rests at 320.60.
  • In the medium-term, its price action has started to evolve within a descending channel from its 01 Mar 2019 all-time high area with its upper boundary now acting as a resistance at 355.20 (see daily chart).
  • The daily RSI oscillator has just staged a rebound from its oversold region and still has room to manoeuvre to the upside before it reaches its overbought region. This observation suggests that price action may see a further bounce at this juncture towards the aforementioned descending channel resistance at 355.20.
  • The 264.50 medium-term support is defined by the lower boundary of the descending channel and the 1.00 Fibonacci expansion of the decline from 01 Mar 2019 high to 15 Aug 2019 low projected from 25 Sep 2019 high.
  • Original Post

    Latest comments

    Loading next article…
    Risk Disclosure: Trading in financial instruments and/or cryptocurrencies involves high risks including the risk of losing some, or all, of your investment amount, and may not be suitable for all investors. Prices of cryptocurrencies are extremely volatile and may be affected by external factors such as financial, regulatory or political events. Trading on margin increases the financial risks.
    Before deciding to trade in financial instrument or cryptocurrencies you should be fully informed of the risks and costs associated with trading the financial markets, carefully consider your investment objectives, level of experience, and risk appetite, and seek professional advice where needed.
    Fusion Media would like to remind you that the data contained in this website is not necessarily real-time nor accurate. The data and prices on the website are not necessarily provided by any market or exchange, but may be provided by market makers, and so prices may not be accurate and may differ from the actual price at any given market, meaning prices are indicative and not appropriate for trading purposes. Fusion Media and any provider of the data contained in this website will not accept liability for any loss or damage as a result of your trading, or your reliance on the information contained within this website.
    It is prohibited to use, store, reproduce, display, modify, transmit or distribute the data contained in this website without the explicit prior written permission of Fusion Media and/or the data provider. All intellectual property rights are reserved by the providers and/or the exchange providing the data contained in this website.
    Fusion Media may be compensated by the advertisers that appear on the website, based on your interaction with the advertisements or advertisers.
    © 2007-2025 - Fusion Media Limited. All Rights Reserved.