💥 Fed cuts sparks mid cap boom! ProPicks AI scores with 4 stocks +23% each. Get October’s update first.Pick Stocks with AI

BOC Optimism and Firmer WTI Boost CAD

Published 12/05/2019, 12:43 AM
Updated 08/22/2024, 06:01 PM
USD/CAD
-
CAD/JPY
-
CL
-

BOC held rates as expected, although their statement was optimistic enough to send the Canadian dollar sharply higher.
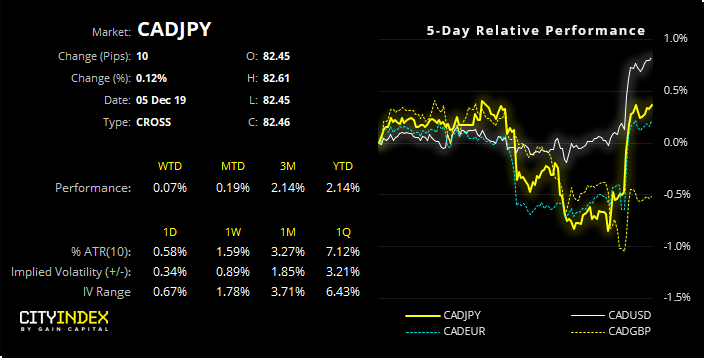
CAD/JPY Relative Performance Chart

The statement was indeed one of optimism, although not hawkish as there is clearly no bias to raise rates. But with a relatively high OCR of 1.75%, it leaves BOC vulnerable to easing in 2020 if data turns against their forecasts. Particularly if trade talks sour. Going forward, we’ll be keeping a close eye on consumer spending and housing activity as they’ll likely hold the key as to whether they’ll remain neutral or seek to ease in the future.

Summary of BOC statement:
  • Maintained OCT at 1.75%
  • Evidence that the global economy is stabilizing
  • Growth slowed as expected, but still expected to edge higher over the next couple of years
  • Housing investment, population growth, low mortgage rates and consumer spending (via higher wages) was a source of strength
  • Investment spending unexpectedly slowed; we’ll continue to monitor its momentum
  • CPI remains on target, and we expect it to track close to 2% over the next 2 years
  • Future rate decision guided by the adverse impact of conflicts against the resilience of Canada’s economy (most notably consumer spending and housing activity)
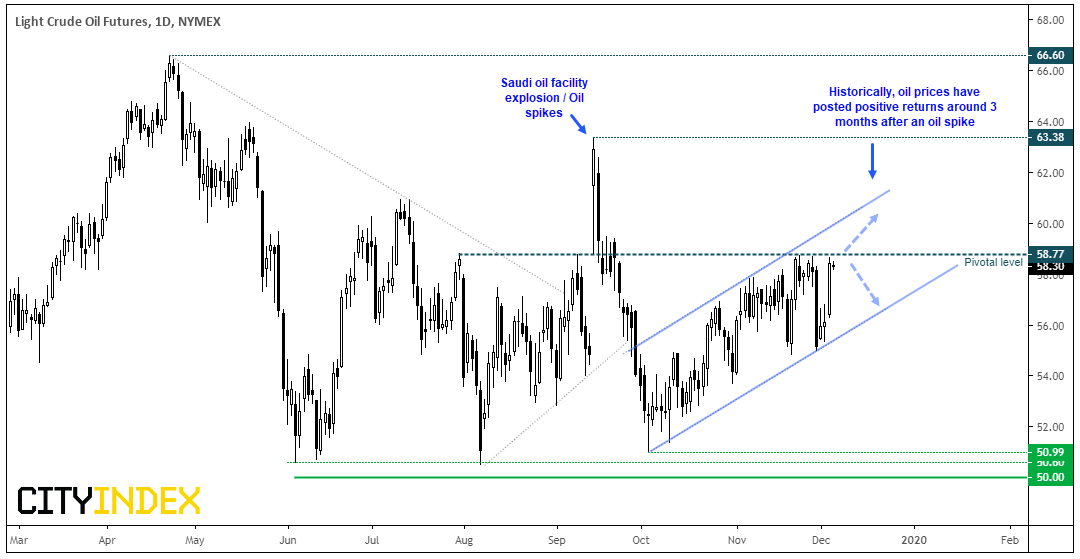
  • Light Crude Daily Chart

    Whilst the positive outlook was clearly a major factor in CAD strength, firmer oil prices also played a part too after a surprise inventory drawdown. WTI enjoyed its most bullish session since September’s oil spike and, if forward returns are to be believed, we could see oil prices rally in mid-December as historically they have rebounded 3-months after a price spike.
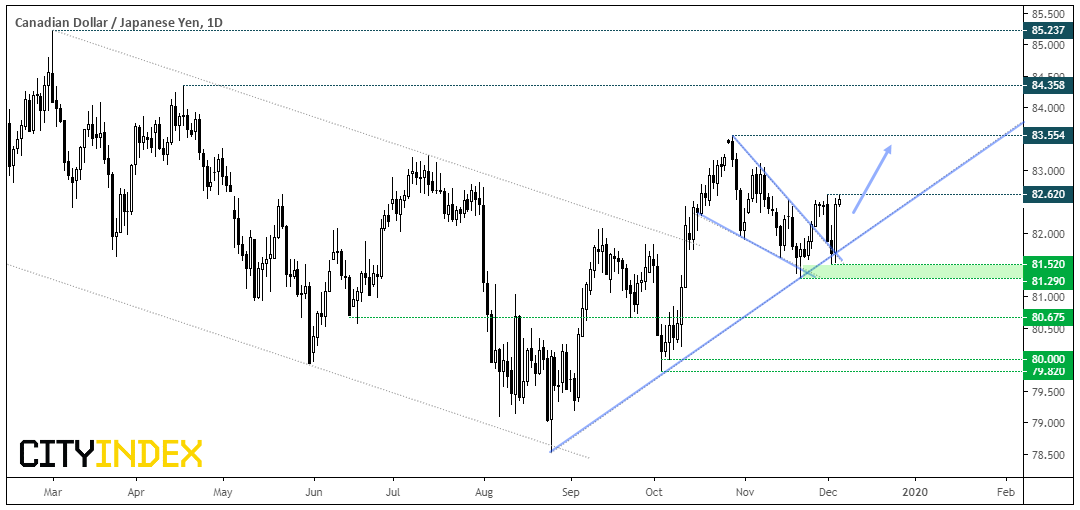
    CAD/JPY Daily Chart

    Technically, WTI sits just below 58.77 resistance within a bullish channel. It’s clearly a pivotal level as it has acted as both support and resistance in recent months, so with prices stalling beneath it, bears could be tempted to fade into move (at least over the near-term). Yet if prices break above 58.77 we’re in a new range and this could likely further support CAD strength.

    CAD/JPY: There have been a few twists and turns along the way, but the bullish wedge pattern remains in play. We have been following CAD/JPY closely has it drifted towards the August trendline, as it was either going to bounce off the trendline and confirm the wedge or invalidate both. Whilst the bounce did occur, bearish price action this week looked set to invalidate the wedge, only to see bullish range expansion take it back up to Monday’s high in breakneck speed.

    For now, momentum favors the bull-cap so we’re looking for a break higher.

  • The bias remains bullish above the trendline / 81.52 low wedge target remains around 83.50
  • A break above 82.62 assumes bullish continuation, leaving traders the option to wait for a break, or assume the break by seeking dips above the trendline (this potentially increases reward to risk ratio, with the added risk it doesn’t breakout).
  • Latest comments

    Loading next article…
    Risk Disclosure: Trading in financial instruments and/or cryptocurrencies involves high risks including the risk of losing some, or all, of your investment amount, and may not be suitable for all investors. Prices of cryptocurrencies are extremely volatile and may be affected by external factors such as financial, regulatory or political events. Trading on margin increases the financial risks.
    Before deciding to trade in financial instrument or cryptocurrencies you should be fully informed of the risks and costs associated with trading the financial markets, carefully consider your investment objectives, level of experience, and risk appetite, and seek professional advice where needed.
    Fusion Media would like to remind you that the data contained in this website is not necessarily real-time nor accurate. The data and prices on the website are not necessarily provided by any market or exchange, but may be provided by market makers, and so prices may not be accurate and may differ from the actual price at any given market, meaning prices are indicative and not appropriate for trading purposes. Fusion Media and any provider of the data contained in this website will not accept liability for any loss or damage as a result of your trading, or your reliance on the information contained within this website.
    It is prohibited to use, store, reproduce, display, modify, transmit or distribute the data contained in this website without the explicit prior written permission of Fusion Media and/or the data provider. All intellectual property rights are reserved by the providers and/or the exchange providing the data contained in this website.
    Fusion Media may be compensated by the advertisers that appear on the website, based on your interaction with the advertisements or advertisers.
    © 2007-2024 - Fusion Media Limited. All Rights Reserved.