Commodities
Snippet from March 22, 2018 Pivotal Events
On base metals (GYX) last week we noted that the action would continue below the 20- Week ema. It has and the decline provides some perspective. The Monthly RSI reached 69 in December which compares to 67 reached with the big cyclical peak in 2011. Within this, copper has accomplished much the same, as have the mining stocks (XME).
The ChartWorks now has targets for an intermediate decline. The high for GYX was 400 in late January and the target is 337. Copper’s high was 3.32 and the target is 2.72. The miners (SPDR S&P Metals & Mining (NYSE:XME)) set the high at 39.57 and the target is 29.
It looks like the Base Metals Sector is working on a cyclical peak, not as dramatic as the one accomplished in 2011.
The targets are for an intermediate move. A cyclical bear market could be recognized after August.
After a sensational rally to technical excess in every measure, lumber has been rolling over. The high was 532 in late February and the first drop was to 474. The rebound was to 496 last week. The rally stayed above the 50-Day ma and yesterday it dipped below.
Breaking below would be significant.
Technical readings have been the strongest since the cyclical peak at 412 in 2013. The cyclical low was 214 in 2015.
For crude, the high for the price and momentum was set at 66.6 in late January. The initial decline was to 58 in February and recent trade was under the 50-Day ma. Then on Tuesday it jumped to 64 and yesterday it got to 65.5. Now it is at 64.40.
Last week, we noted the support at the 50-Day and looked for weakness into mid-year.
We updated lithium two weeks ago when we noted that after a momentum high it was rolling over. The break was steep and there have been some bounces. However, the Daily RSI got as high and stayed there longer than at the cyclical peak in 2011.
The rally from 16 in early 2016 has been supported by the 20-Week ema. The high for LIT was 41.21 and the hit was to 33, and the bounces made it to 37 and then to 36. Both were at the declining 20-Week ema. Lithium’s decline of the last two days took out the 200-Day ma. Taking out the 33 level sets the bear market.
This is another item that set excesses not seen since its cyclical peak in 2011.
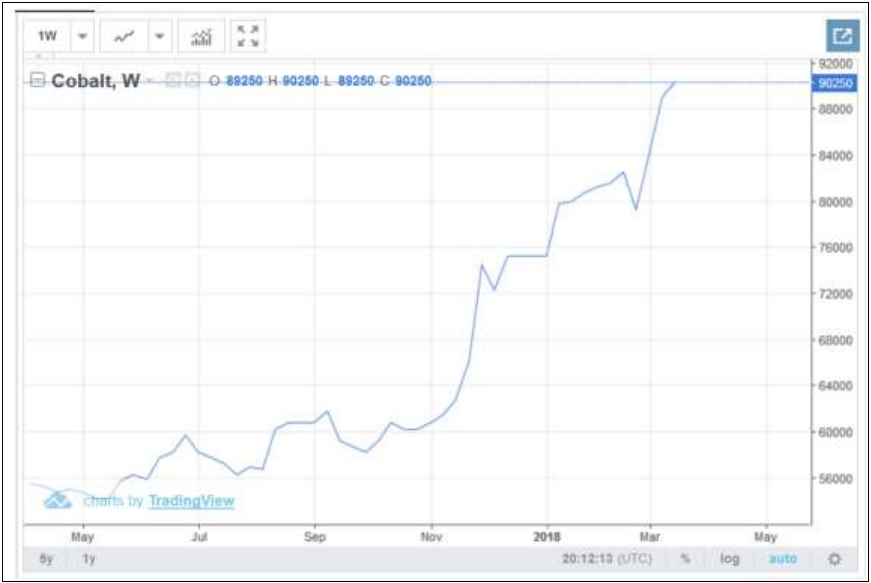
Cobalt’s rally is now approaching parabolic. The chart is above.