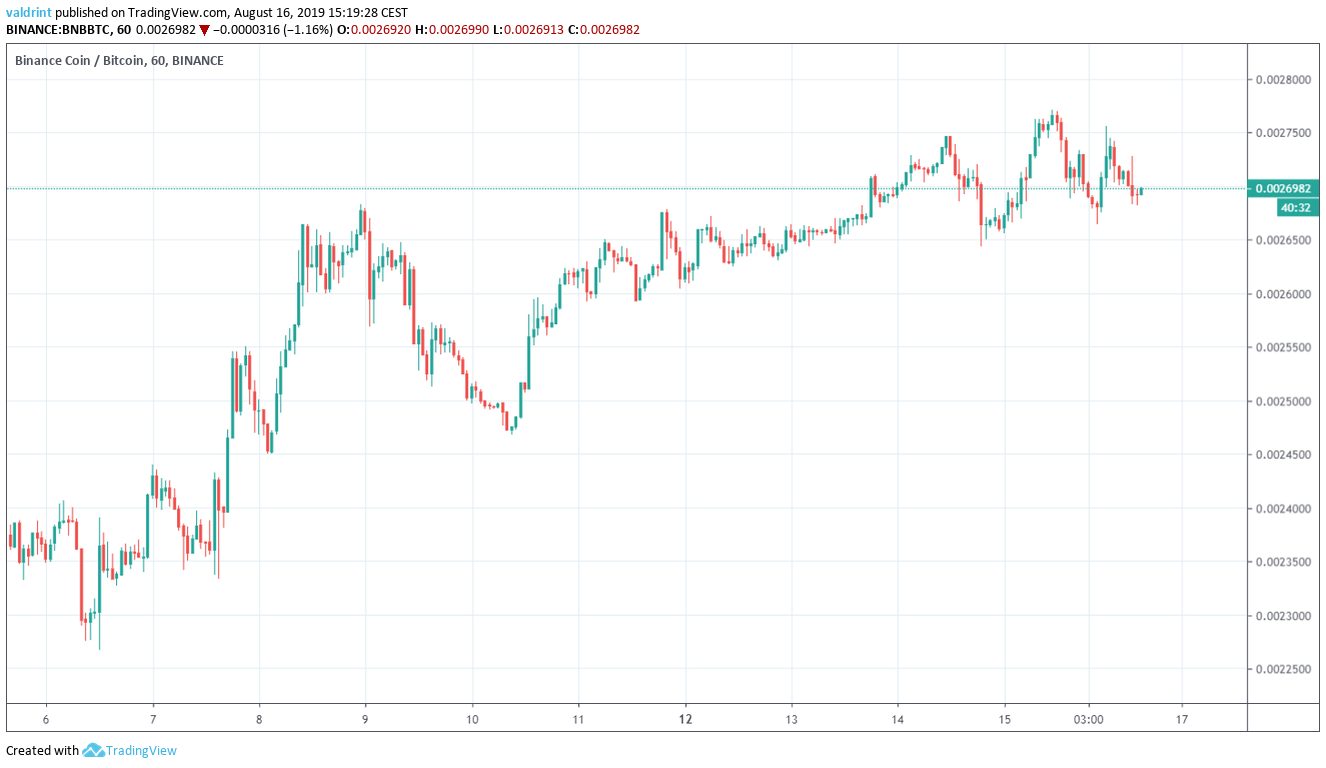
On August 7, 2019, the Binance Coin price reached a low of 22,667 satoshis. An upward move ensued. The next day, BNB reached a high of 26,833 satoshis. After a brief decrease, the price resumed its upward movement and eventually reached a high of 27,710 on August 15.
Will the BNB price continue to increase or does a reversal await? Continue reading if you are interested in finding out.
Binance Coin Price: Trends and Highlights for August 16
Ascending Wedge
A look at the hourly time-frame shows that the Binance Coin price has been trading inside an ascending wedge since August 7.
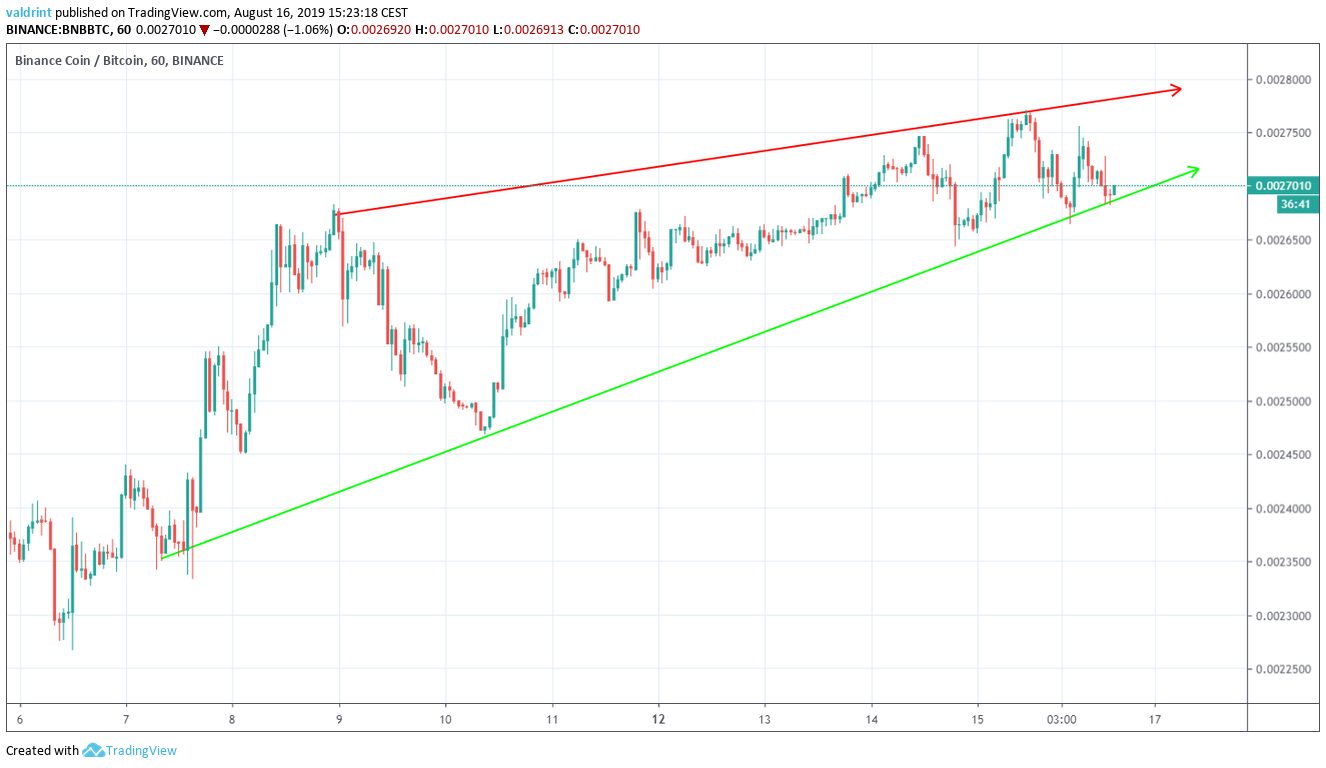
The ascending wedge is considered a bearish pattern, making a price breakdown more likely.
At the time of writing, the BNB price was trading very close to the support line.
Additionally, it is approaching the end of the pattern.
Therefore, the Binance Coin price is likely to make a decisive move soon.
BNB Price Long-Term Pattern
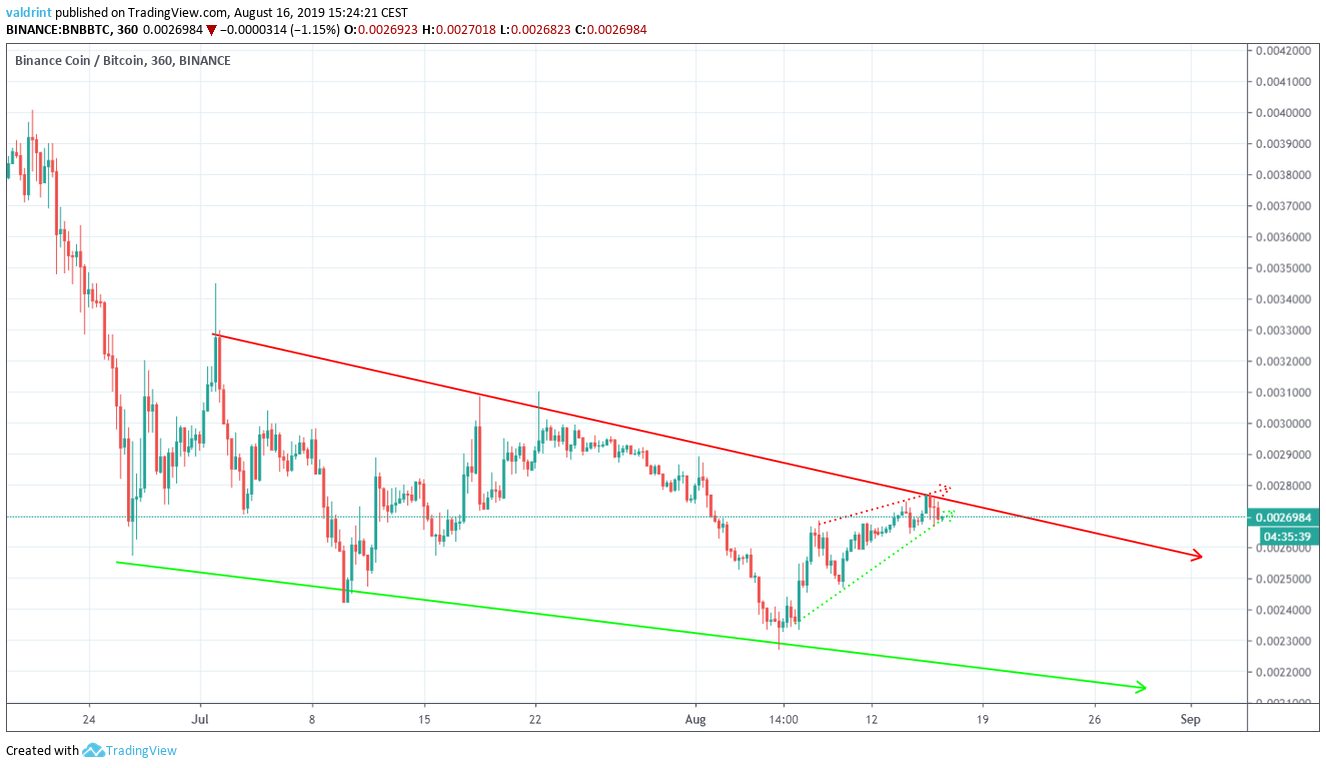
A look at the six-hour time-frame shows that the ascending wedge discussed in the previous section is engulfed inside a longer-term descending wedge.
The Binance Coin price is trading very close to the resistance line.
Since it has created a bearish pattern close to resistance, a breakdown seems likely.
Let’s take a look at technical indicators to see if we can confirm our hypothesis.
Possible Reversal
A look at the RSI and MACD confirms that a breakdown is likely to occur.
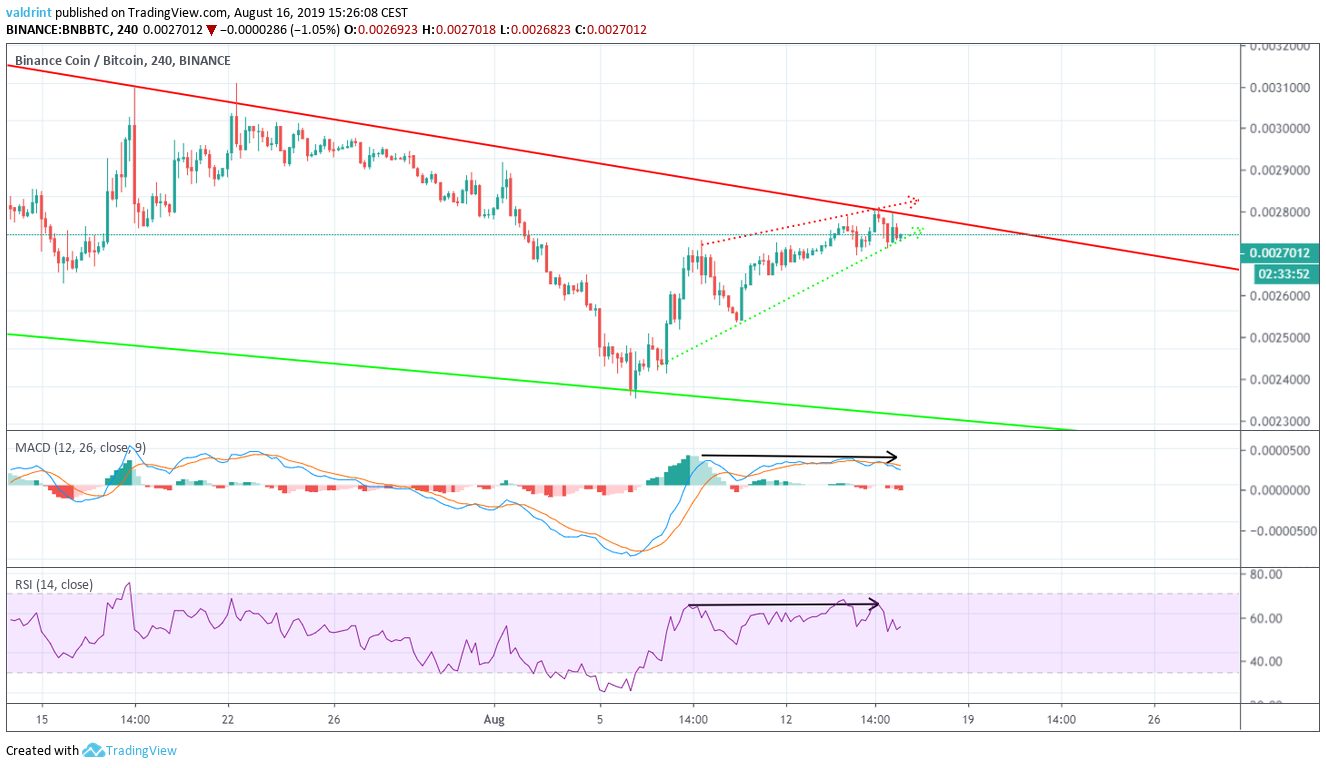
Both have been generating bearish divergence for the entire duration of the wedge.
While the Binance Coin price divergence is not extremely significant, it is present in both indicators and present inside a bearish trading pattern.
Support Areas
In case a breakdown occurs, one support area is outlined below.
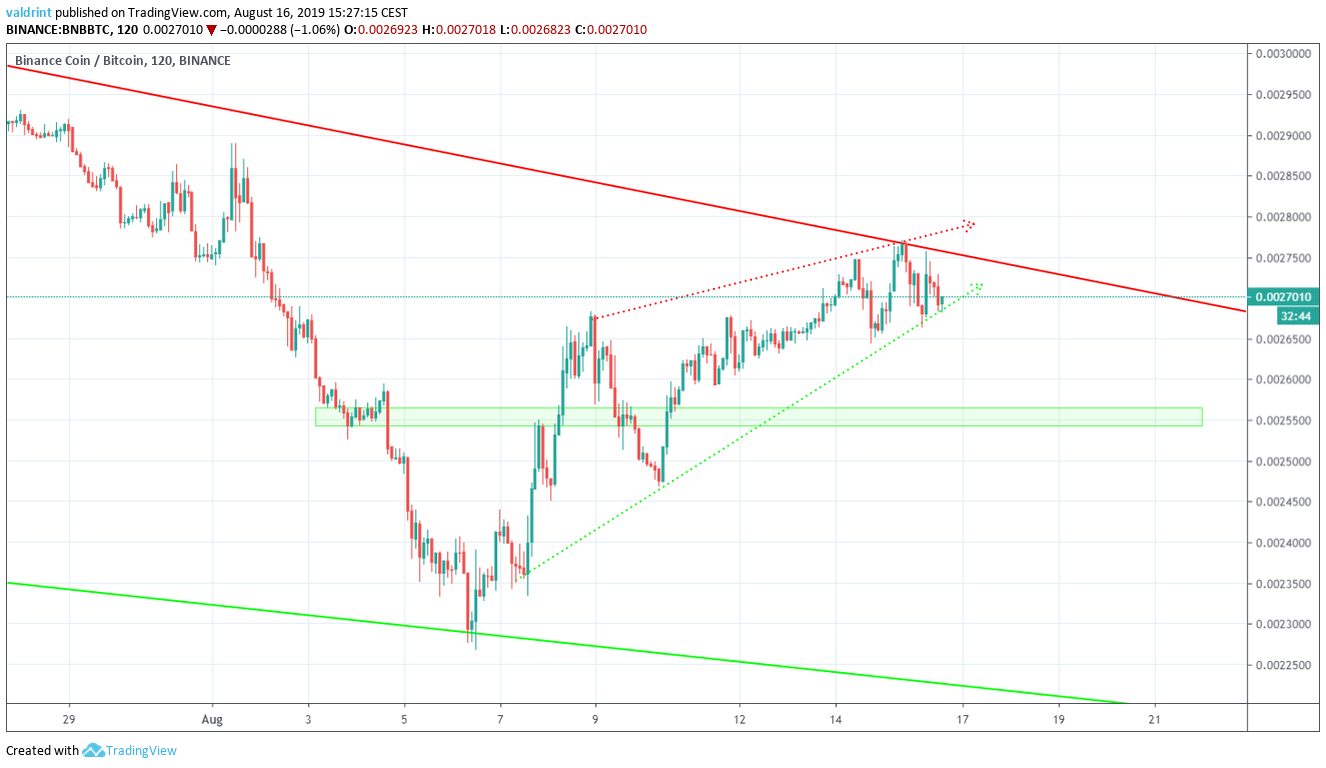
It is found at 25,500 satoshis.
According to our analysis, the Binance Coin price is likely to reach it.
Binance Coin Price Summary
The BNB price is trading inside a short-term ascending wedge.
According to our analysis, it is likely to break down and reach the support area outlined above.
