Investing.com’s stocks of the week
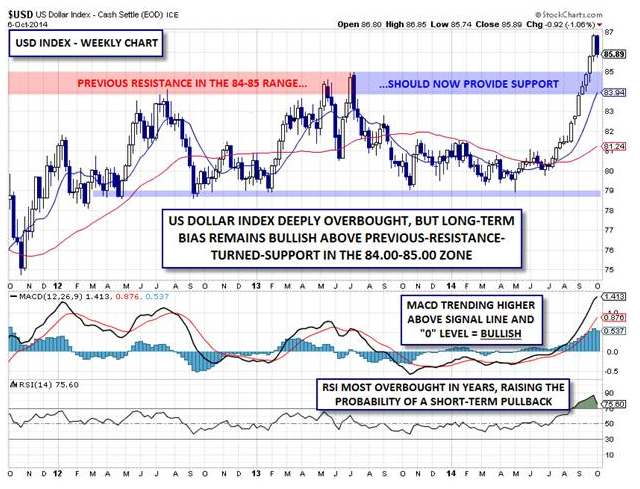
After the tremendous run we’ve seen over the last few months, we wanted to take a step back and put the recent USD rally into context. The widely-followed dollar index (below), which represents the US dollar against a trade-weighted basket of the euro, pound, yen, Canadian dollar, Swedish krona, and Swiss franc, has rallied an incredible 12 consecutive weeks. This is the longest streak since US President Nixon began allowing the dollar to float freely back in 1971!
The fundamental catalysts for this move are well-known by now. Strong economic data out of the US has prompted the Federal Reserve to taper its QE program (with the final taper on track for later this month) and start considering raising interest rates as soon as Q1 2015. Meanwhile, many of the dollar’s major rivals have stumbled since this summer, with both the ECB and BOJ mulling additional monetary stimulus, whereas the RBNZ has paused its hiking cycle far sooner than many traders anticipated. Even the Bank of England is having second thoughts about the timing of its first rate hike, which optimists had previously penciled in by New Year’s.
While some shorter-term charts are suggesting that the dollar rally may finally take a breather this week, the fundamental tailwinds remain in favor of continued dollar strength heading into 2015.
Technical View: US Dollar Index
From a technical perspective, the dollar index recently saw a major breakout above previous resistance in the 84.00-85.00 area, which had previously capped the index in mid-2012 and mid-2013. In fact, the index reached a 4-year high last week before pulling back early this week.
The secondary indicators are also supportive of further gains long term, though there is still room for a shorter-term dip. The lagging MACD indicator is trending above both its signal line and the “0” level, showing strongly bullish momentum, but the weekly RSI indicator is more overbought than it has been at any point in the last decade. Given the extreme RSI reading, a near-term correction or consolidation may be in the cards, but as long as rates hold above previous-resistance-turned-support in the 84.00-85.00 zone, the longer-term uptrend will remain intact.
To the topside, the US Dollar Index actually has blue, clear skies all the way up to its 2009-10 highs in 88.50-89.50 zone. For traditional FX traders, a rally toward this level may correspond to an extended drop in the EURUSD toward 1.20 in time. That said, a break back below the key 84.00-85.00 region would open the door for a deeper retracement in the dollar index, and a corresponding bounce back in EURUSD.

