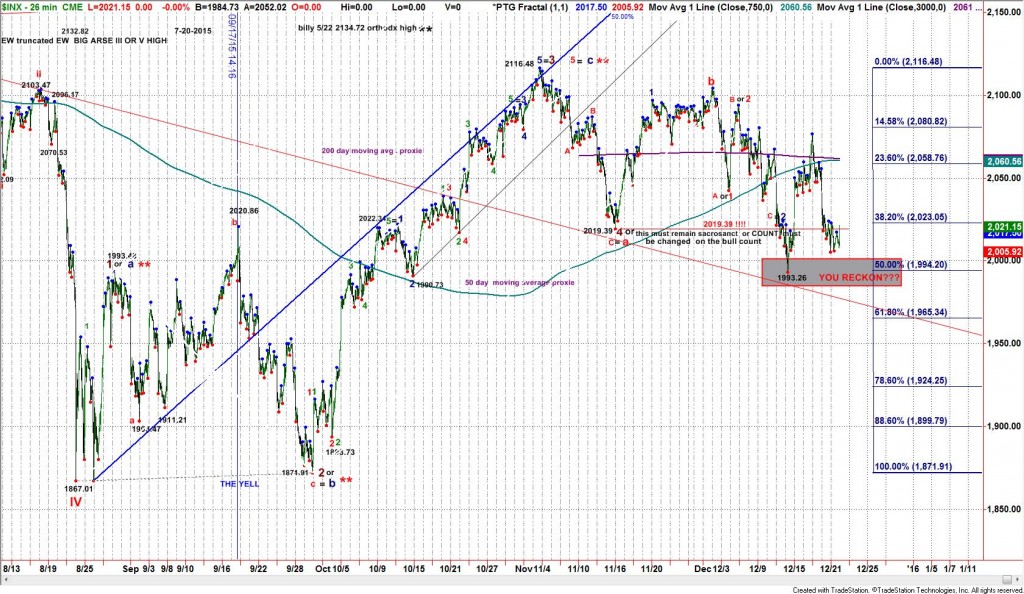
Today is Series S2L IFFY and the spill is down. Yesterday the market gapped up 17.9 handles and immediately moved to Friday;s mid p.m. high just under the 2015 spot @ 2014.5. This creates a dilemma as to rather or not we were doing the 79 spill odds down or 21 up. It also means that if we are doing the spill down 79% then it is very high odds the spill down will be residua and not fill the gap.
In the commentary the 2007-2009 ES baand was given as a sticky place meaning it should show demand and/or support when approached from above and below. As price declined from 2014.5 several key posts for the remainder of the day were given:
“I am still viewing this as 79 SPILL DOWN with an a.m. high to come. ”
“Use 2015 and 1998 SPOTS and WORK IN.(to work in simply means USE THESE AS THE OUTER EDGE SPOTS and work within them basis YOUR TA…common sense says they are risk markers for something else is happening if one end or the other gives way. “
The a.m. high failed 1.5 handles below the 2015 spot and when we took out 2007-2009 sticky on the back through we made a beeline for the 1998 spot. Price needs were given for a long trade using the 1998 spot and the ensuing rally died right smack dab in the 2007-2009 sticky zone. When we gave up the 2002 daily pivot to the 2004.5 spot price made another push down to the 1998 spot. At that point it seemed it would be a lock for a 32% low odds outcome but the bears failed to kill the 98 and make a new LOD… At 2001 ES a comment was issued that the bears were dropping the soap again and the rest of the day from the 3:41 book square was a SU zoom move to the close at the 2015 spot.
While I am giving the day an S2L lean with normal play being a.mn. low to last hour high. This is not a slam dunk.. The bulls need the normal and the bears need the S2h or aberrant turns such as a lunch high lower than the a.m. high or the mid p.m. low being lower than the a.m. low. Read that carefully and think about the basic definition of a trend –lower highs and lower lows or higher highs and higher lows …

