The Biotech sector has been a difficult place to put money over the last year. There have of course been many winners, and many losers. For the investor who does not have the resources to pick a winner out of the field it has been a challenge to stay involved. The ups and downs of the sector can be seen in the Biotech ETF, iShares Nasdaq Biotechnology (NASDAQ:IBB). And there have been a lot of them over the last 12 months.
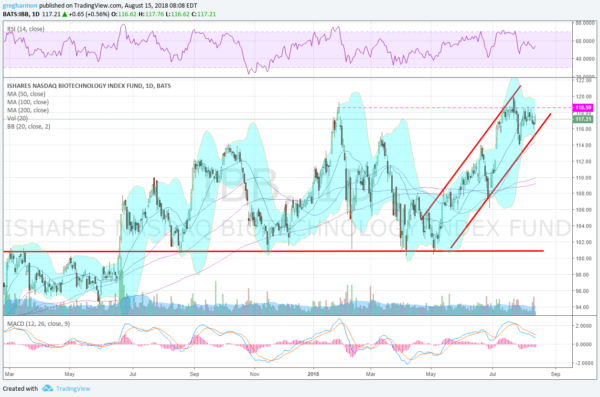
The chart below shows the move over resistance in June of 2017 and continuation higher. It stalled in July and pulled back to retest that break out level. The reversal made a higher high and we were off to the races. But then another pullback to retest support. And another higher high in January. But that one could not hold up either and a third test of support ensued.

A close look at this last move higher reveals some interesting price action. The rebound off of the April low was only to the 100 and 200 day SMA’s and it fell back again. the rise from that May low kept going though. Confirming a double bottom as it passed over the 200 day SMA. A drop back in June tested the 200 day SMA as support and held, leading to a reversal and higher high. Again. This time the pullback found support at a higher low.
It is hovering near the January high and just under the July high now as the Bollinger Bands® are tightening. This is often the precursor for a move. The RSI is holding in the bullish zone as the MACD has reset lower and remains positive. Continuation of this activity, making a higher high, would be a significant change of character for the Biotech sector. A new dawn or blooming of the rose.
The information in this blog post represents my own opinions and does not contain a recommendation for any particular security or investment. I or my affiliates may hold positions or other interests in securities mentioned in the Blog, please see my Disclaimer page for my full disclaimer.
