After the US markets close today, Morgan Stanley (NYSE:MS) will announce whether Chinese stocks get the green light for inclusion in its emerging-market index.
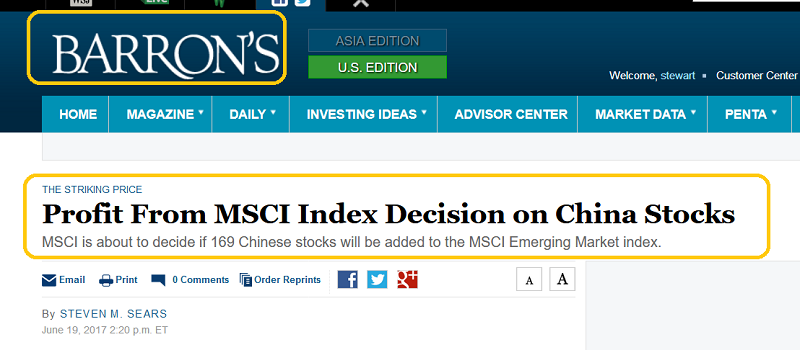
This announcement has the potential to create substantial international liquidity flows into Chinese stocks.
That can have a very positive effect on the price of gold. Here’s why: Gold plays a huge role in Chinese culture. When the citizens are happy or in the mood to celebrate, they buy gold.
For most of 2017, the Chinese stock market has left the US market in the dust, and today’s announcement could add even more zest to the rally.
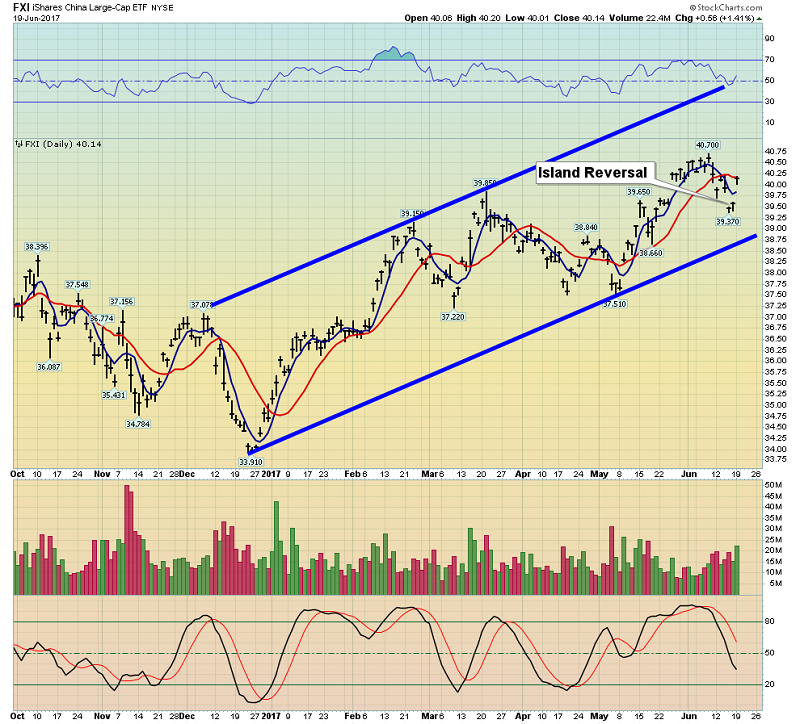
This is the iShares China Large-Cap (NYSE:FXI) chart (a Chinese stock market ETF).
It’s clear that even without inclusion in the Morgan Stanley indexes, the Chinese stock market is roaring higher. Note the bullish island reversal pattern that is in play now.
The Chinese gold market (especially the market for investment grade bars of gold) is recovering in step with the new bull cycle in Chinese stocks.
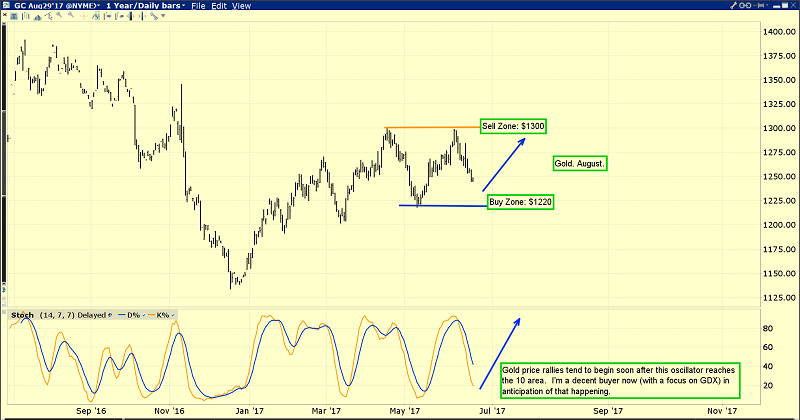
This is the daily gold chart. I realize that gold market investors are a bit disappointed that gold hasn’t surged above $1300 in 2017, but good things come to those with patience.
Note the position of my 14,7,7 Stochastics oscillator at the bottom of the chart. Gold tends to rally when it reaches the 10 area (it’s near that now). When it reaches the 90 area (as it did a few weeks ago), gold tends to soften.
It’s not rocket science; from a technical perspective, gold tends to “breathe”, much like a person does.
Most of the major trends in the gold market tend to be related to the ebb and flow of Chindian demand. Commercial traders operating on the LBMA and the COMEX use leverage to essentially magnify the price action.
Most of gold’s price rally in 2017 was caused by Chinese New Year demand. That waned in February. The general trend has been sideways since then, which is normal for this market.
The rallies to $1300 in March and May were related to India’s Akha Teej festival demand, and the Indian government’s decision to levy a modest GST rate for gold.
I’ve been adamant for years that gold is a much bigger market than most investors realize, and it’s so big that Chindian demand can affect Western bond and currency markets. It can be argued somewhat persuasively that the Fed doesn’t move the gold price. The gold price action moves the Fed.
Since February, gold has been consolidating quite majestically. Gold bugs should act now to jettison any petty fears they have about future price action.
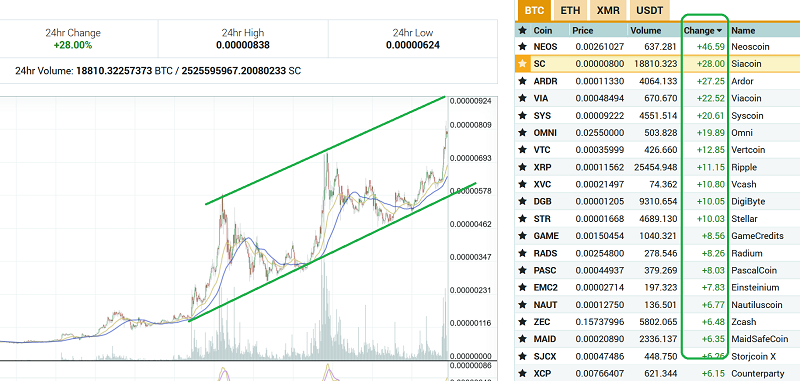
Note the numerous blockchain currencies I’ve highlighted, and their fabulous gains over just the past 24 hours.
I cover blockchain in detail at my gublockchain.com website, and I view it as the newest sub-sector of the precious metals asset class.
That’s because most of the blockchain currencies were designed around the nature of gold and the difficulties involved in mining it. In a nutshell, blockchain currencies are electronically mined. Most of the founders of this market have a philosophy that is very anti-establishment, anti-government, and pro-gold.
Blockchain has been warmly embraced by precious metal investors in the East, who are generally younger than the “old guard” gold bugs of the West. Fresh approaches like blockchain are a welcome addition to the fight against fiat currency systems promoted by governments.
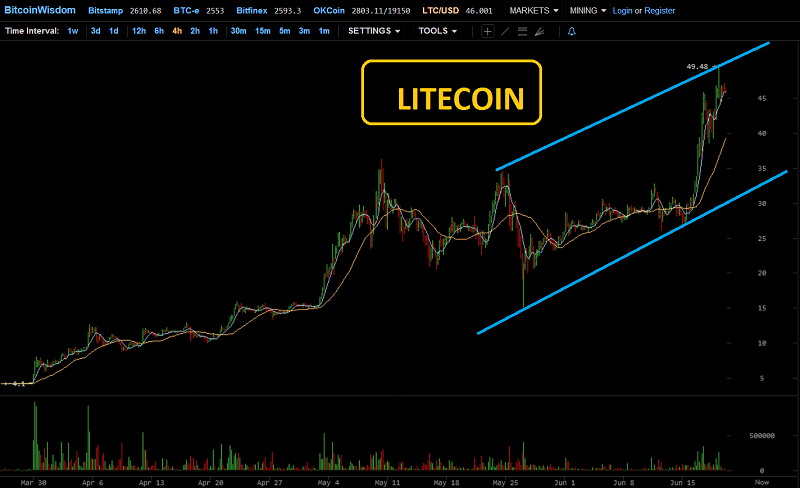
Many older gold bugs in the West are also getting in on the blockchain action, and that’s good news. Litecoin surged about 80% higher in 72 hours over the week-end, while gold and stock markets were closed.
I view litecoin as the “silver bullion of the blockchain world”, and bitcoin is like gold. The bottom line may be that blockchain is not just the newest kid on the precious metals investment block…it’s also the hottest.
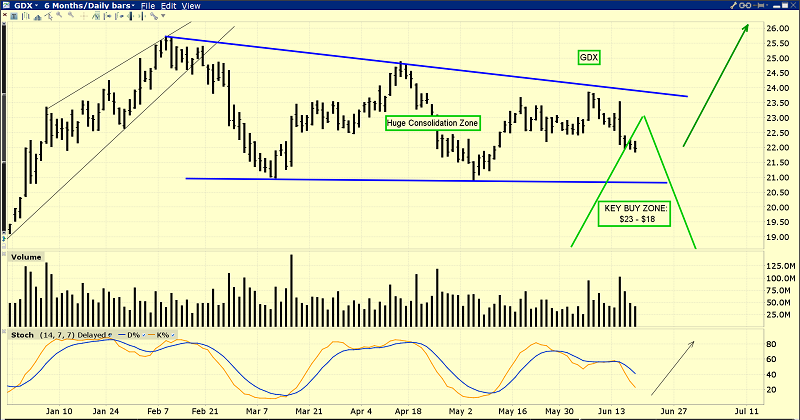
This superb VanEck Vectors Gold Miners (NYSE:GDX) chart. Investor fear about gold stocks is unfounded, and I’m a “power-buyer” of GDX on every ten cents decline in the current price area.
The triangular consolidation is perfectly normal for this time of year. Note the excellent position of my Stochastics oscillator at the bottom of the chart.
GDX is probably just days or hours away from the next rally. My strongest recommendation to global gold stock enthusiasts is to jettison bad memories of the past and get serious about participating in the upcoming upside fun for gold stocks. To participate in the rallies of tomorrow, investors need to be buyers today!
Thanks!
Risks, Disclaimers, Legal
Stewart Thomson is no longer an investment advisor. The information provided by Stewart and Graceland Updates is for general information purposes only. Before taking any action on any investment, it is imperative that you consult with multiple properly licensed, experienced and qualified investment advisors and get numerous opinions before taking any action. Your minimum risk on any investment in the world is: 100% loss of all your money. You may be taking or preparing to take leveraged positions in investments and not know it, exposing yourself to unlimited risks. This is highly concerning if you are an investor in any derivatives products. There is an approx $700 trillion OTC Derivatives Iceberg with a tiny portion written off officially.
