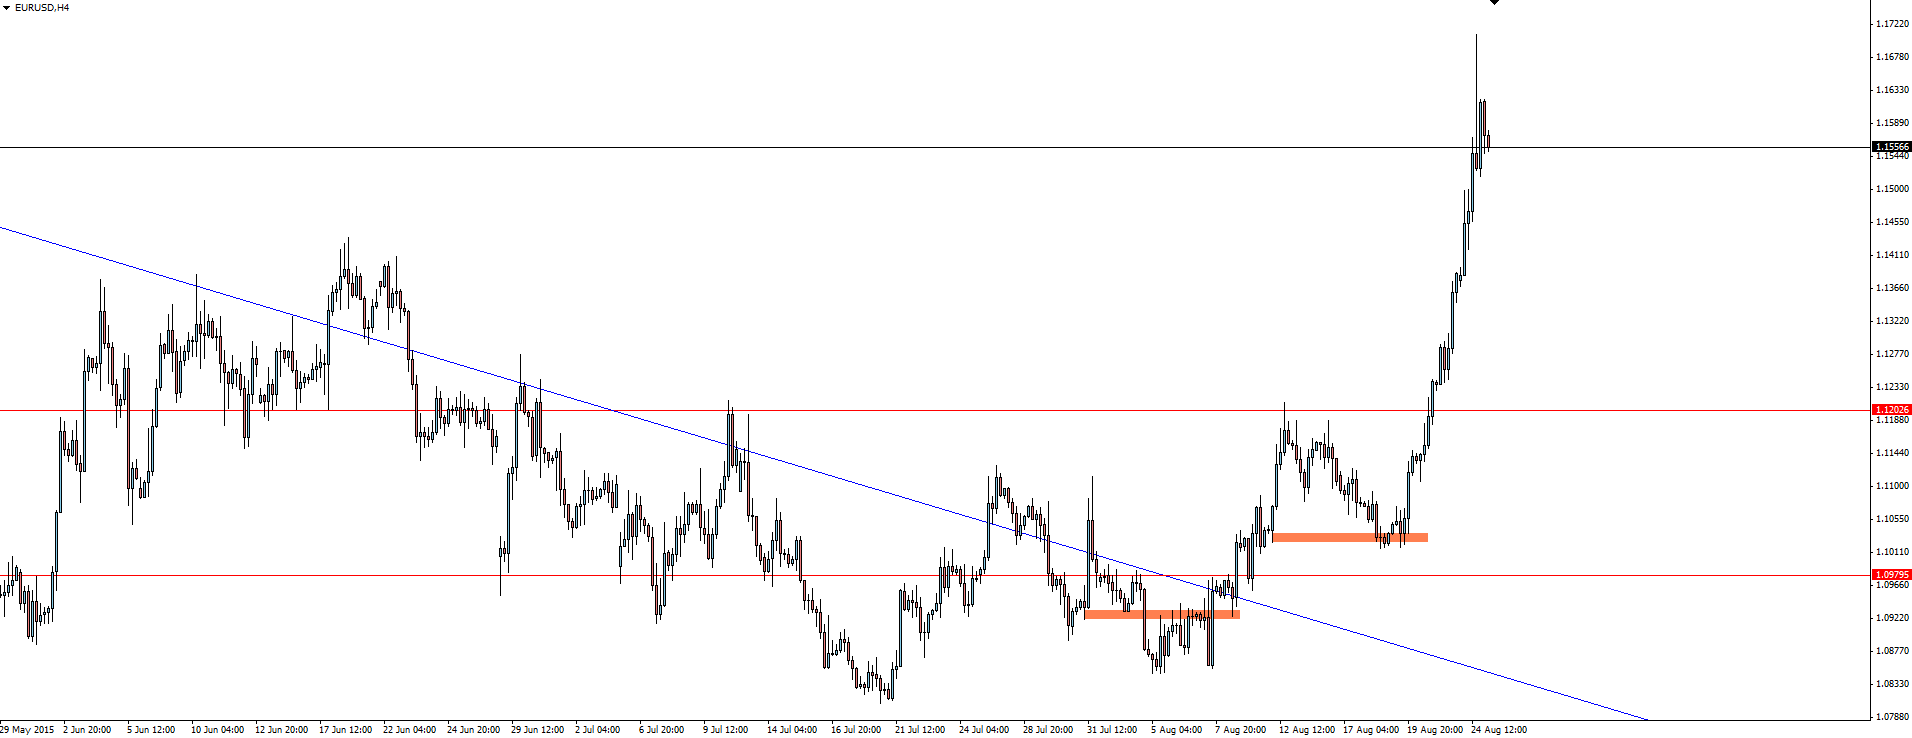
Let’s take a look at the damage Black Monday has done to our Forex charts. We have a look at what price has done to begin the week and most importantly try to look forward and discuss some actionable ideas around where to from here.
We’ll go through some of the key charts here with a look at the bigger picture in a longer time frame chart and then zoom it in a bit more from there.
EUR/USD Daily: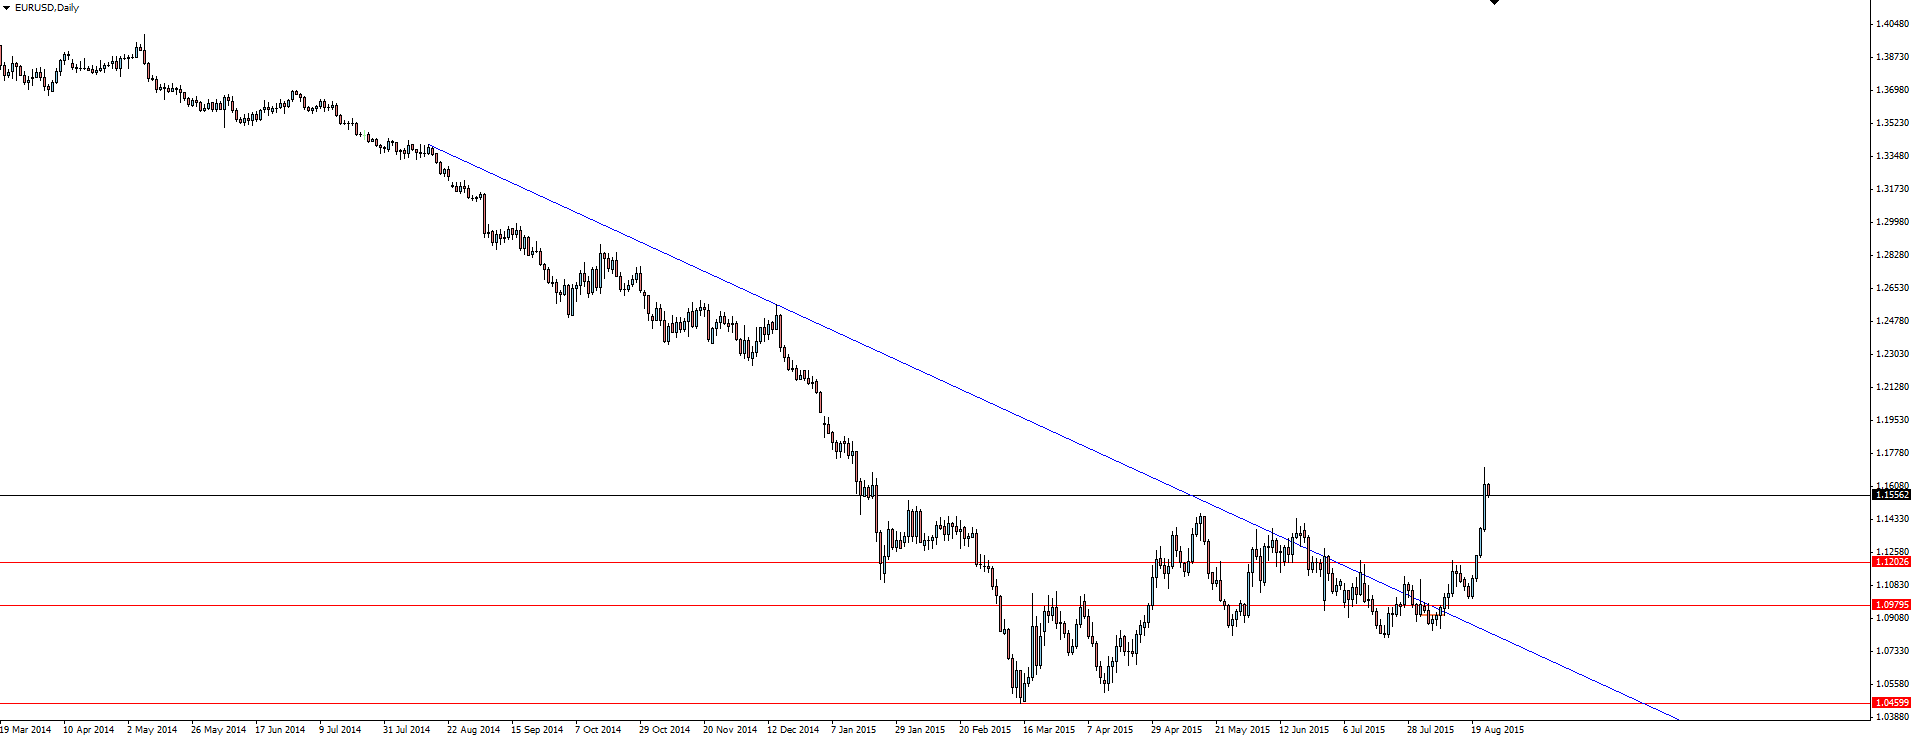
While not the biggest mover, I find this chart to be the most amazing. After all the doom and gloom surrounding Greece and the Fed raising rates putting parity on the cards, for price to actually have tested it’s yearly highs on this move is just unreal!
The long, bearish trend line you see marked here has now been well and truly broken and the Black Monday fear combined with a large number of major players unwinding their short exposure saw the mother of all squeezes back up to where we sit now.
I still cant be too bullish EUR/USD but charts and momentum don’t lie and I don’t like the idea of jumping in front of this moving train here.
I’ve tried to mark a few zones where in hindsight an argument could have been made to position yourself long, but even this is a stretch. With all the chopping in and out of that trend line leading up to that breakout, I had zero conviction in and buying strength and just had to watch this one fly away to the moon without me.
Just have to admire that vertical move.
AUD/USD Weekly: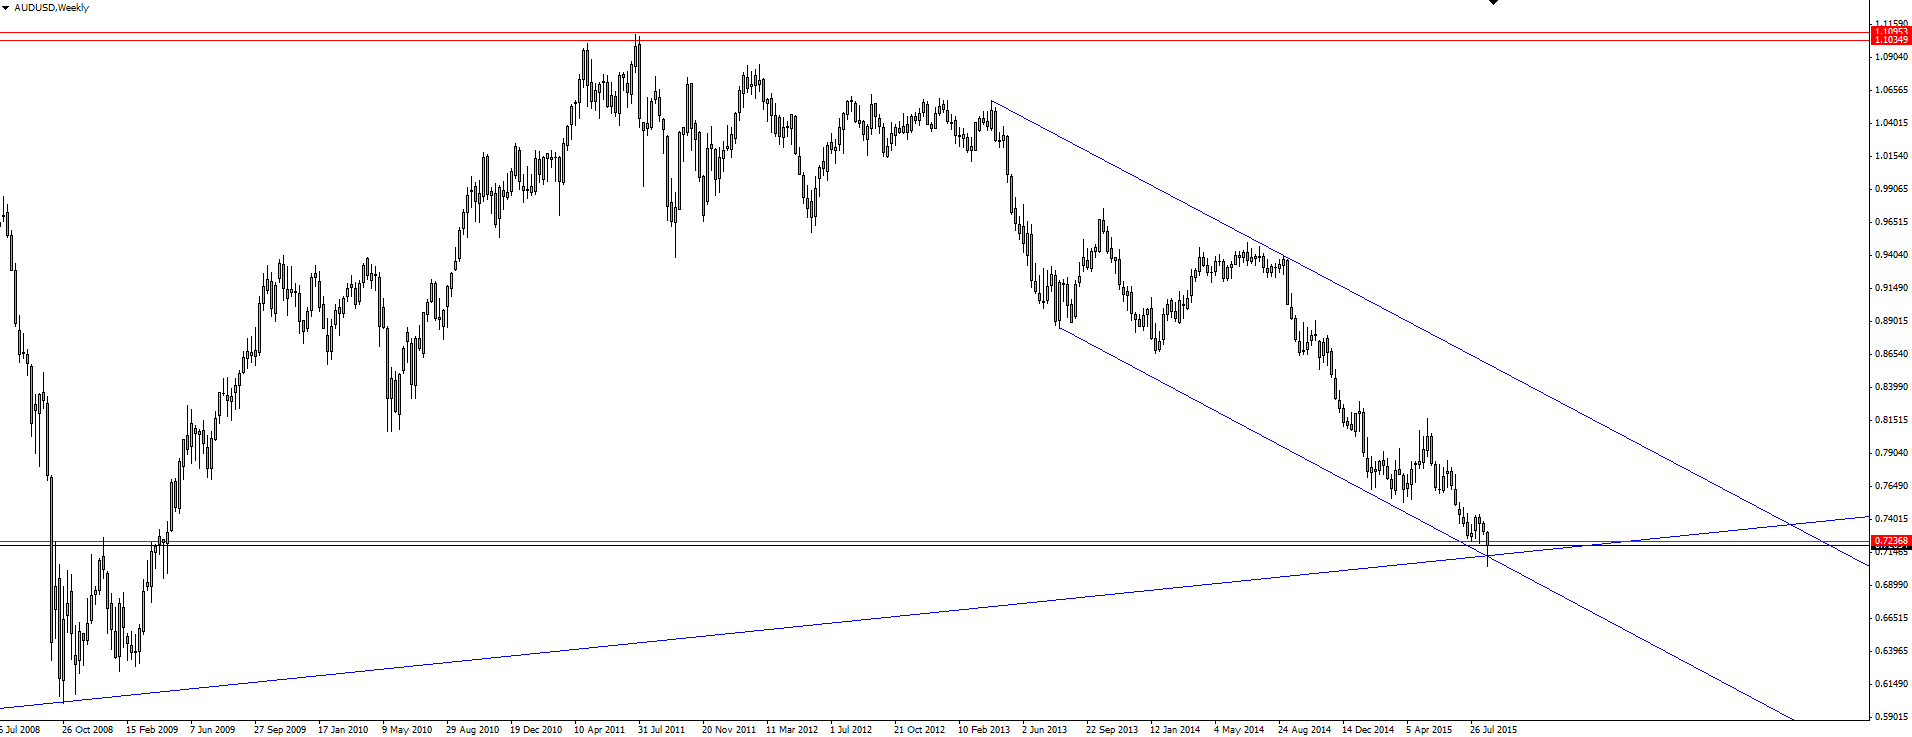
We’ve been talking about this major weekly confluence of support on AUD/USD for a while now and last night’s move pushed price down to finally give it a test. A test that it passed with flying colours!
As you can see by the long wick on that one day old weekly candle, price rejected the level hard and fast and has done nothing but rally out of it since.
AUD/USD 4 Hourly:
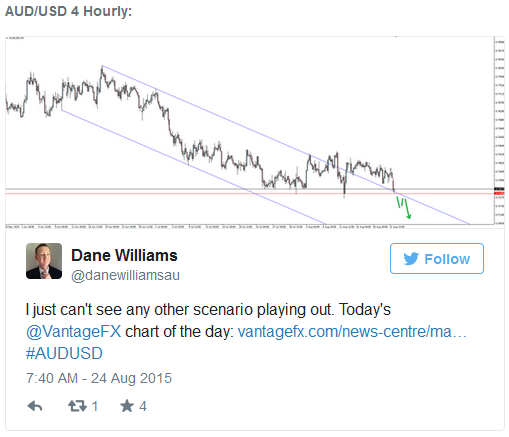
Short term though, it’s always nice when your scenarios play out!
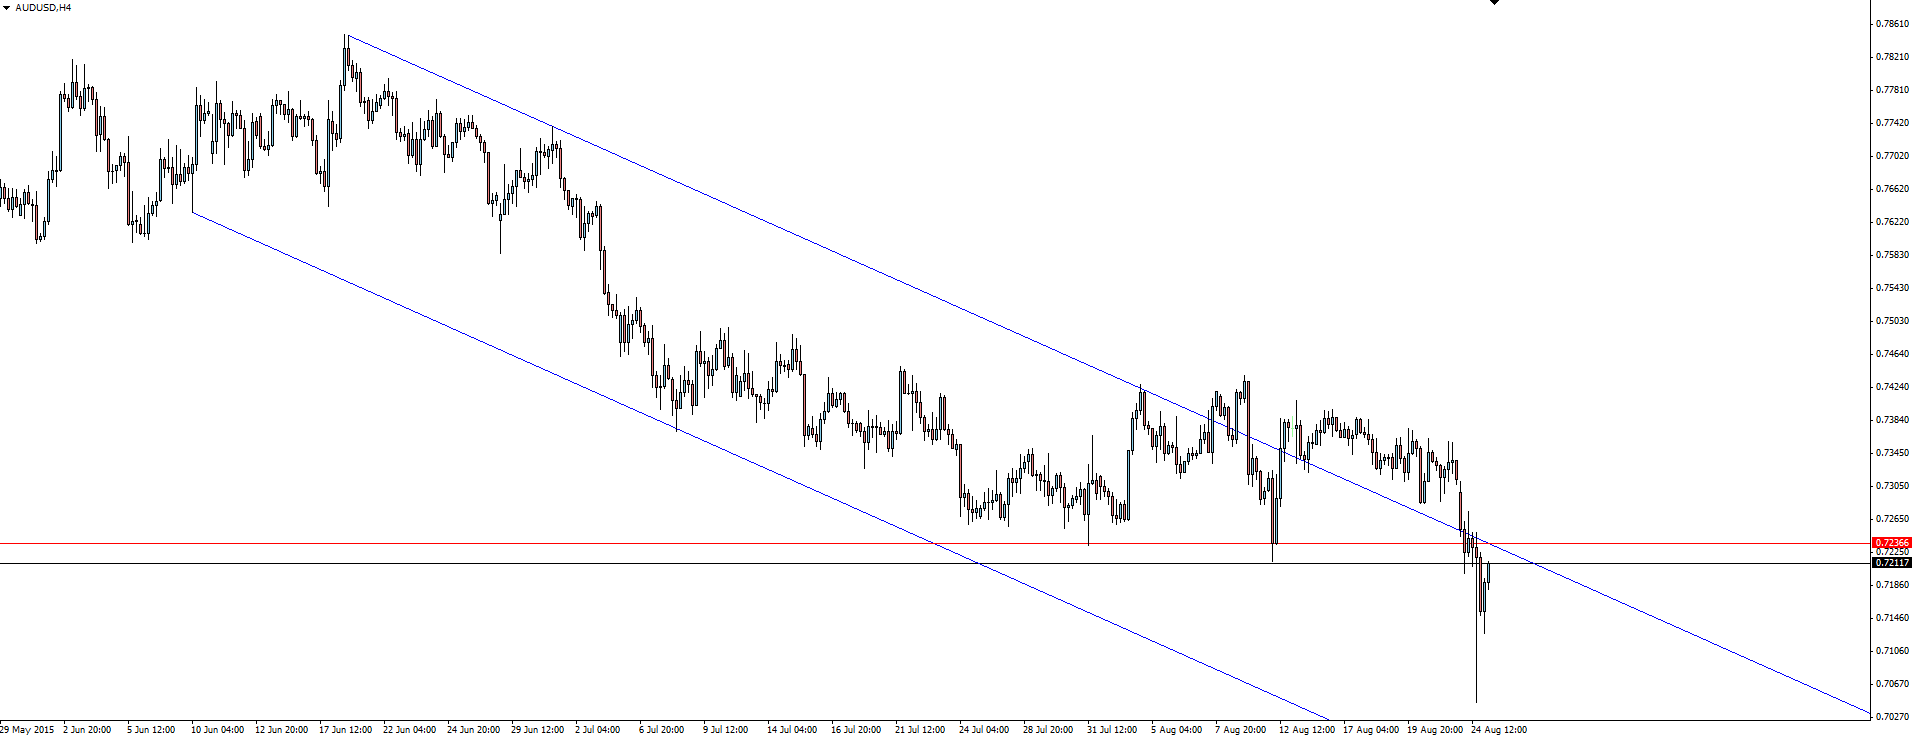
After last night’s move, a tight, 4 hourly channel shouldn’t be what you continue to base your trades around or honestly you’re just asking to be stopped out by a whipsaw.
That makes this short term chart pattern void for now and although this little recovery bounce looks to have a bit of merit, it’s still all about what happens on the NY Pit Open again.
NZD/JPY Daily: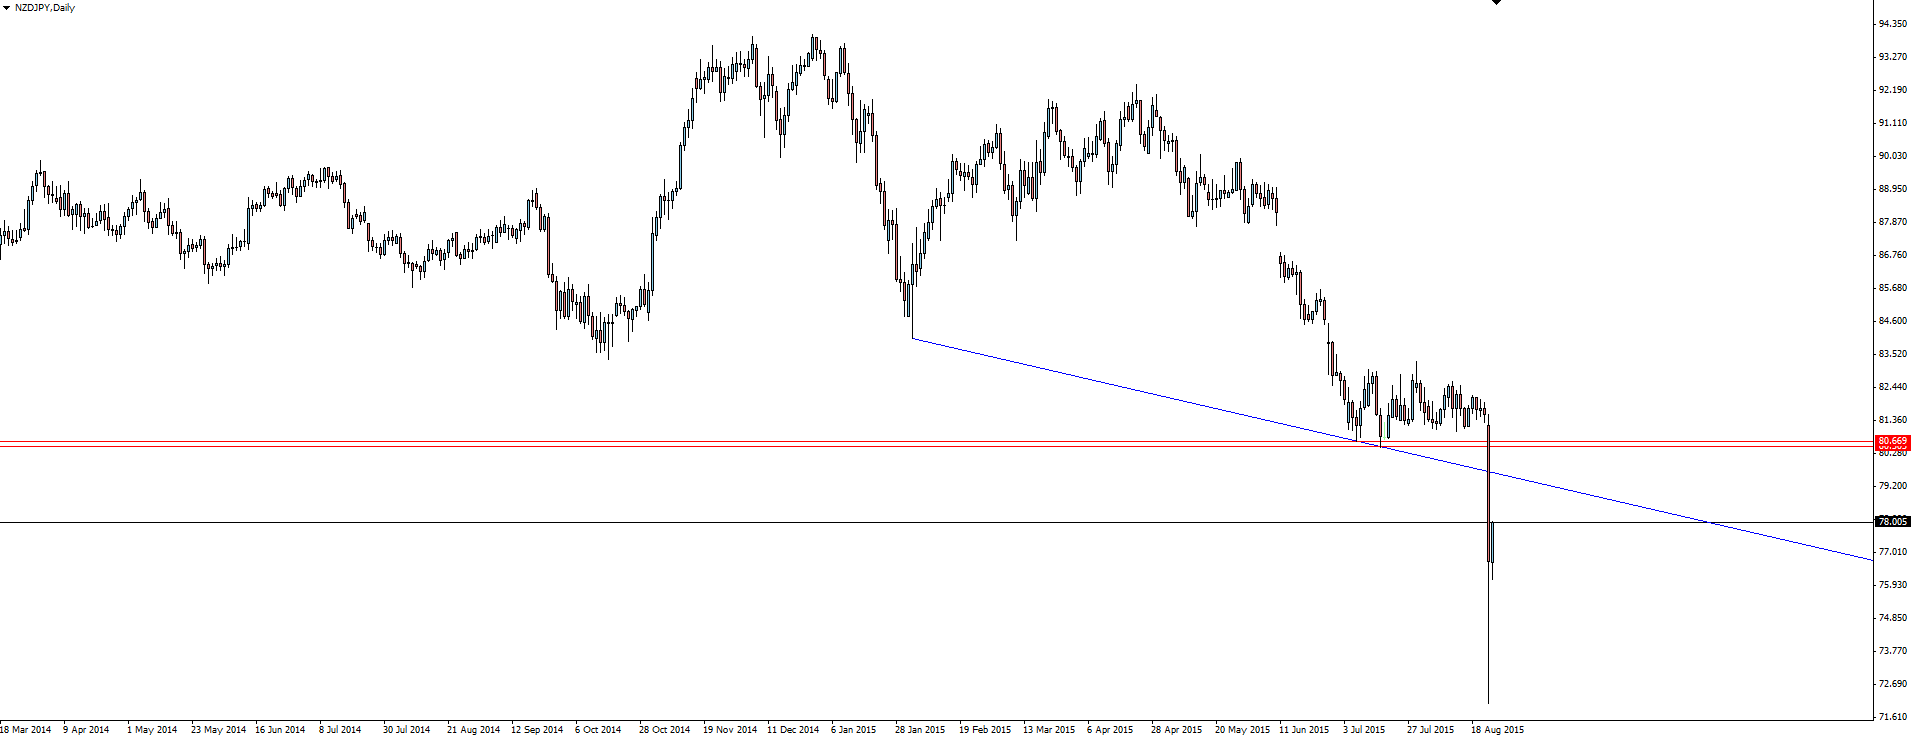
While not a chart that I normally keep on my watch list, the fact that one of the biggest moves came on this pair caused me to sit up and take some notice.
NZD/JPY 1 Minute: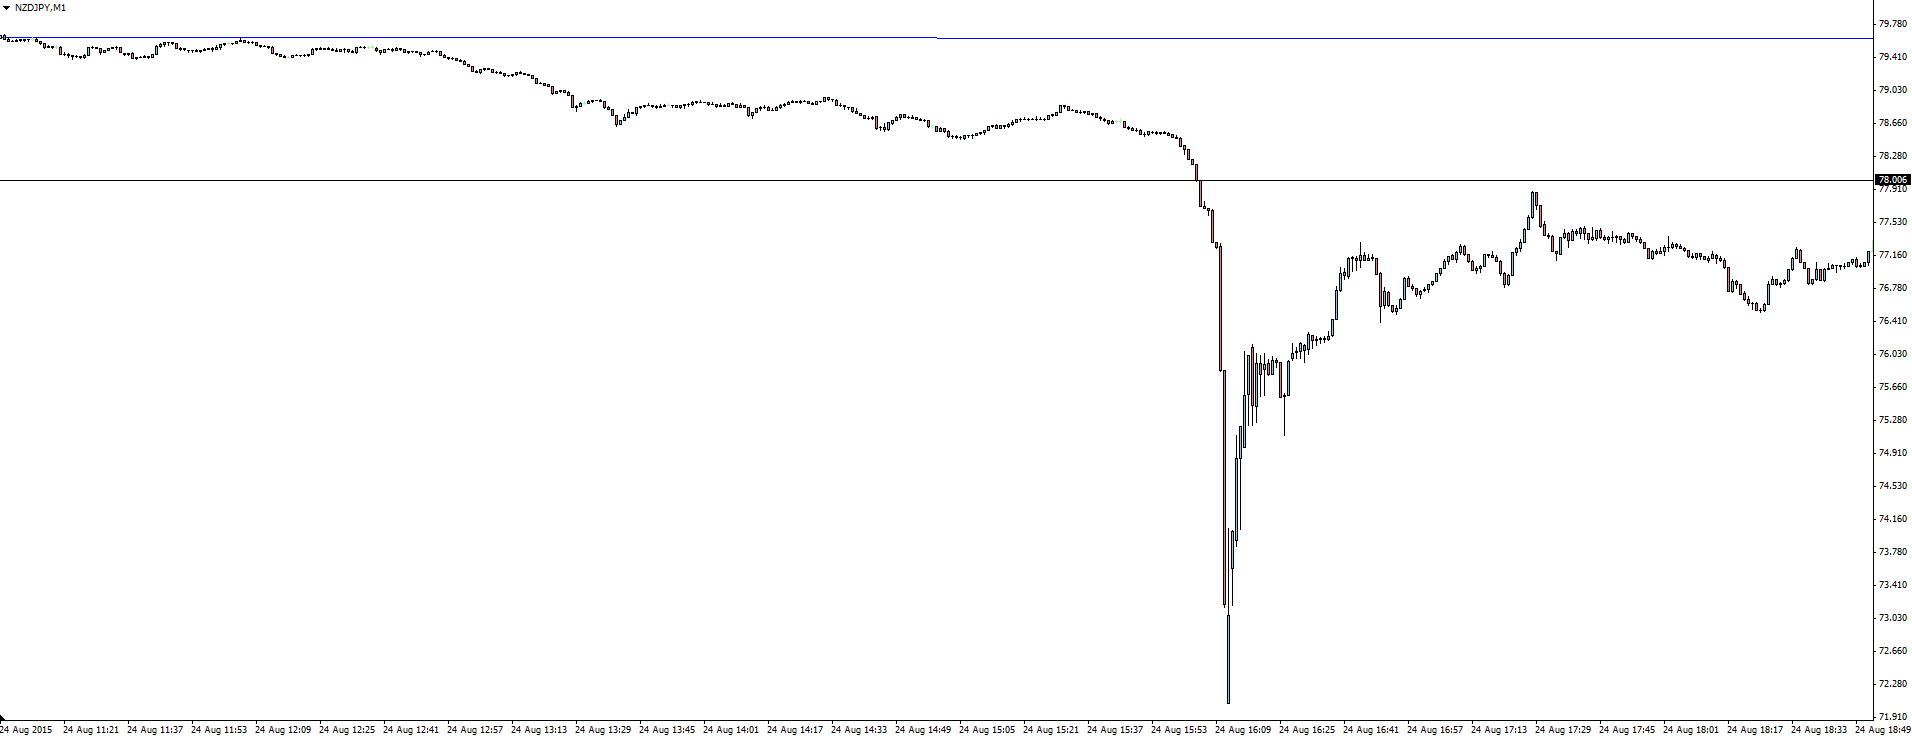
Yes, that is what a ONE THOUSAND PIP MOVE in ONE DAY looks like on the 1 minute chart.
Risk Disclosure: In addition to the website disclaimer below, the material on this page prepared by Vantage FX Pty Ltd, does not contain a record of our trading prices, or an offer of, or solicitation for, a transaction in any financial instrument. The research contained in this report should not be construed as a solicitation to trade. All opinions, news, research, analyses, prices or other information is provided as general market commentary and marketing communication – not as investment advice. Consequently any person acting on it does so entirely at their own risk. The experts writers express their personal opinions and will not assume any responsibility whatsoever for the actions of the reader. We always aim for maximum accuracy and timeliness and Vantage FX shall not be liable for any loss or damage, consequential or otherwise, which may arise from the use or reliance on the service and its content, inaccurate information or typos. No representation is being made that any results discussed within the report will be achieved, and past performance is not indicative of future performance.

