When Bitcoin was trading at $10700s, and the GreyScale Bitcoin Trust at low $11s, I already made the case in my first article that
“odds are starting to increase a more significant low is forming for GBTC (and also BTC)”
I have since kept you abreast of BTC’s advance, which also surprises me as I was looking for a top for (green) minor wave-1 at “ideally around $13750 +/- 250”. Although it means my assesment was wrong, as BTC is now trading at $15000, it underscores the saying “In bullmarkets upside suprises and downside dissapoints”.
Why was I wrong? Because the elliott waves started to subdivide, which means extensions beyond standard/text-book lengths. That can always happen and is impossible to foresee. All I can initially go by are standard wave-lengths. e.g. wave-3 is 1.618x wave-1. When the market then decides to make the third wave 2.618x the first wave, I will adjust accordingly.
From a trading perspective, this means one should not put stops too tight as to not get stopped out too early. If one does prefer tighter stops, one can then simply buy the next breakout as that is technically the sign for an extended wave. Or put it differently “ there’s always a next bus to catch”.
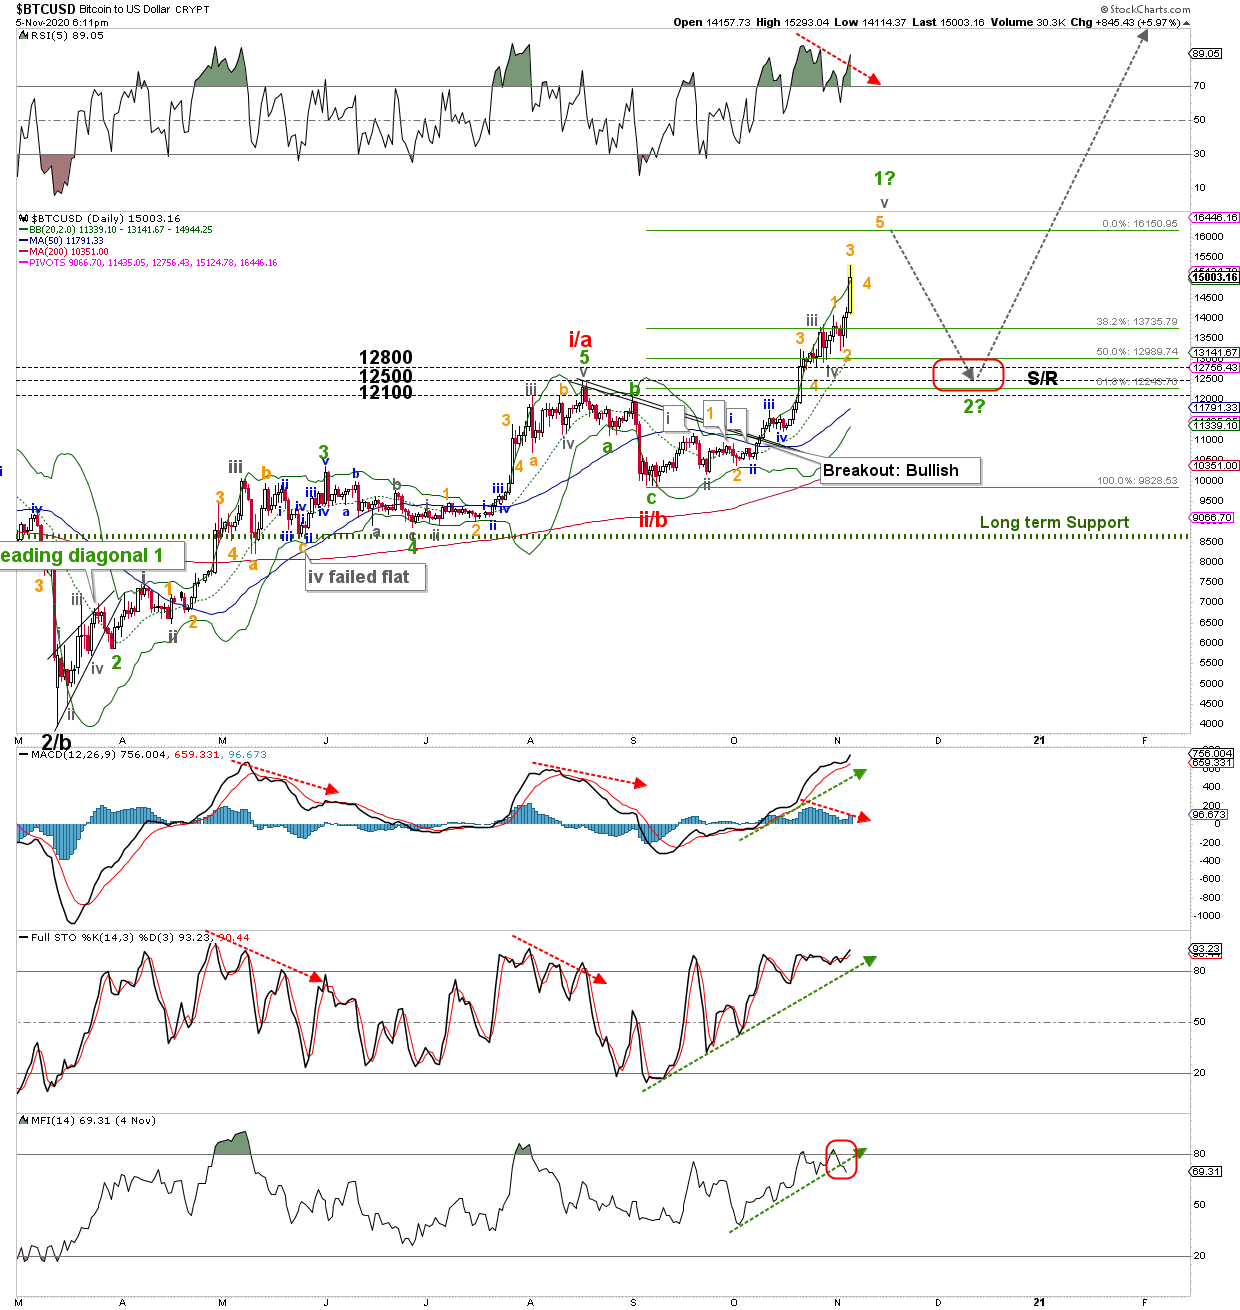
Bitcoin daily candle stick chart with detailed bullish elliott wave principle (EWP) count

But, eventually all good things come to an end, and it appears BTC is in an extended, subdividing (grey) minute wave-iv of (green) minor-1. I prefer to see one more (orange) micro-5 to ideally around $16150+/-150, before green wave-2 comes along and targets support at $12100-12800. See the chart above. After two comes three, and that third of a third of a third of a third wave (3 of iii of 3 of III) should rally BTC well into the mid- to high-20Ks. Thus the best is IMHO yet to come.
Bottomline
Despite the extended waves, ultimately nothing has changed in the charts from what I found in my prior article:
“With price above its rising 20-day Simple Moving Average (SMA), which is above the rising 50d SMA and which is in turn above the rising 200d SMA, this is a 100% Bullish chart and thus a Bullish Elliott Wave Principle perspective must be continuoulsy prefered. Besides, all the technical indicators (RSI5, MACD, Stochastic Oscillator, and Money Flow Index) are all pointing up and are on a buy, supporting the notion for continued higher prices.”
This is how technical analyses and the EWP can support each other, and I therefore continue to look higher for BTC and for GBTC until the market tells me otherwise, which is a move below last week’s high (orange wave-1) from current levels followed by a move below the recent (grey) minute-iv low.
