On Thursday, we showed you how Elliott Wave analysis set the stage for a Bitcoin plunge to under $7700 ten days before Mark Zuckerberg’s Libra testimony. The cryptocurrency was barely holding above $7400 at the time of writing and many thought it was prone to decline even further.

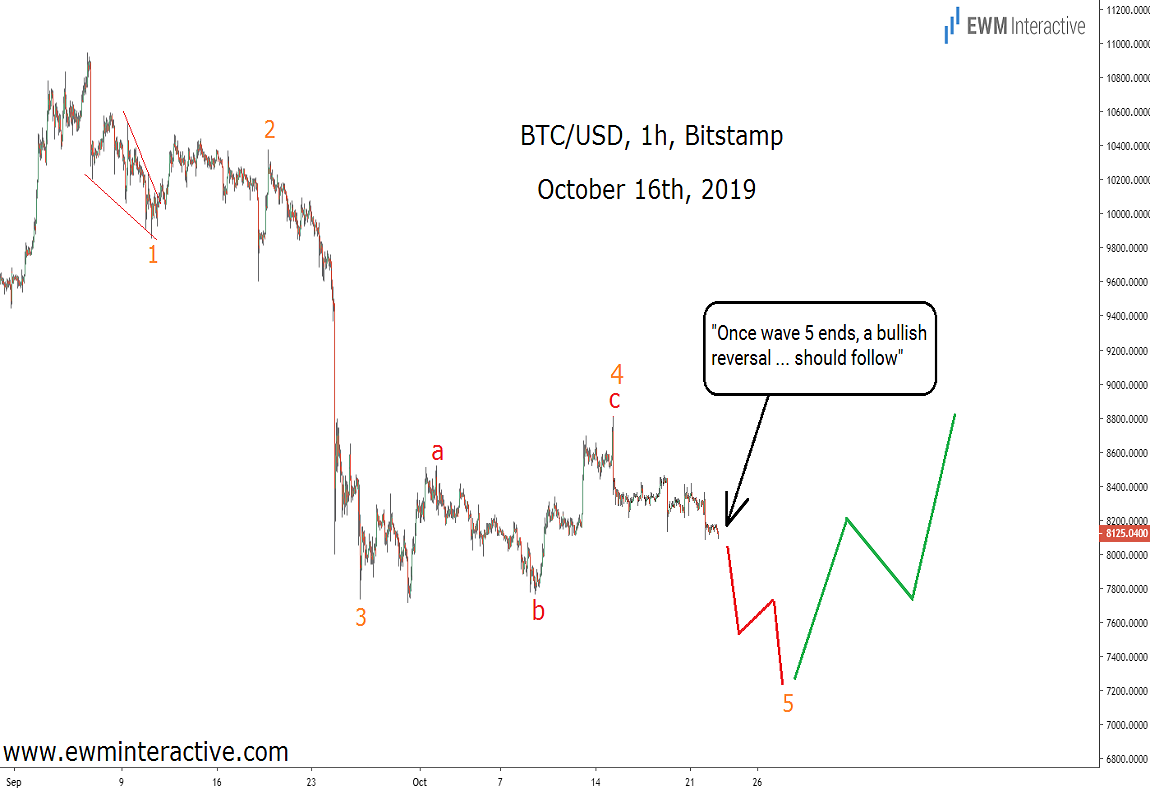
Since Bitcoin is among our premium instruments, we deliberately left some information out two days ago. Traders, familiar with the basic rules of the Elliott Wave principle probably figured it out by themselves. The chart below from October 16th shows Bitcoin’s 40% surge in the past 12 hours didn’t come out of the blue after all.
One of the basic Elliott Wave rules states that every five-wave impulse is followed by a move in the opposite direction. Bitcoin’s decline from $10 949 looked like an almost complete impulse pattern. Wave 5 was the last missing piece. That is the reason why, ten days ago, we thought “once wave 5 ends, a bullish reversal … should follow.”
Better Be Approximately Right Rather Than Precisely Wrong in Bitcoin
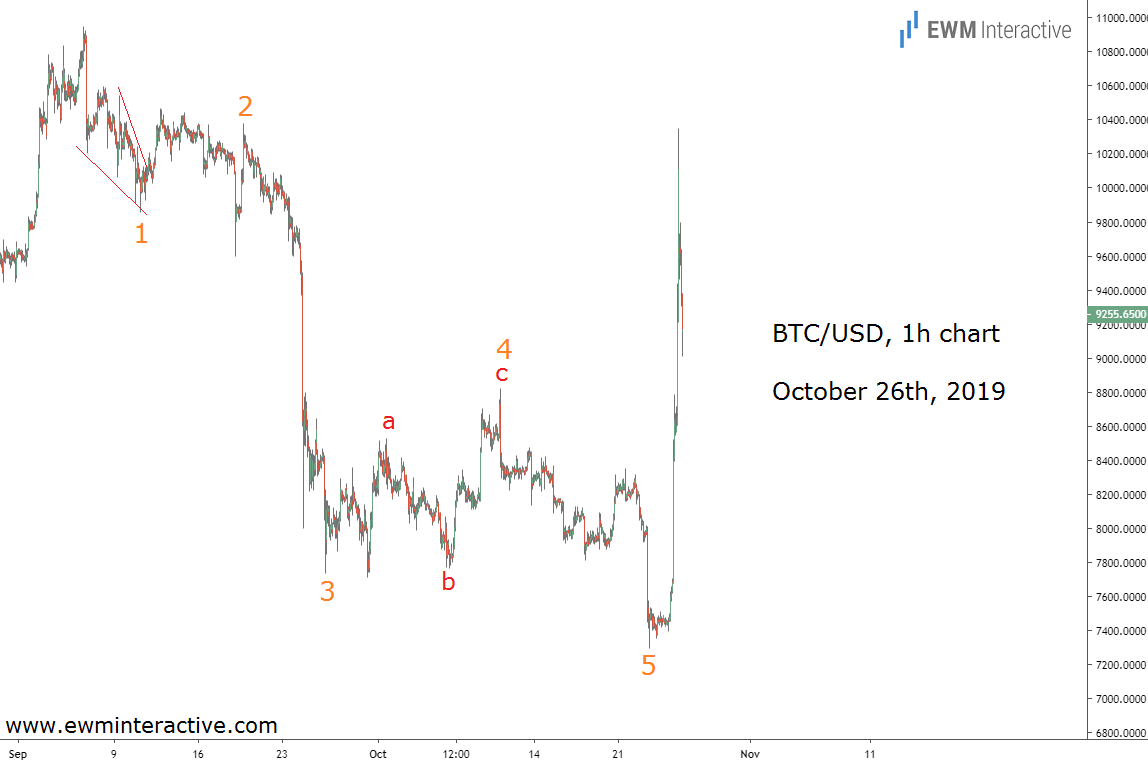
Of course, there was no way to predict the speed and sharpness of the recovery. In addition, we thought the resistance near $8800 was at least going to slow the bulls down for a while. Well, we didn’t get that right, as the updated chart below proves. What matters is the fact that Elliott Wave analysis prepared us for a bullish reversal at a time when most traders were extremely bearish.

Wave 5 ended at $7293 on October 23rd. We didn’t know that this was going to be the bottom at the time, but picking bottoms is not a good idea anyway. The important thing was that the decline from $10 949 could already be seen as a complete five-wave impulse. From an Elliottician’s point of view, this meant the $7300 area was no place for short positions. As of this writing, BTC/USD is hovering around $9300 following a spike to $10 350.
Now, instead of looking for external factors to explain Bitcoin’s surreal surge, it is time to focus on the patterns again. If a pattern managed to put us ahead of this U-turn, maybe a pattern is going to put us ahead of the next one, too.
