Black Friday is Now! Don’t miss out on up to 60% OFF InvestingProCLAIM SALE

Bitcoin’s $1000 Breakaway CME Gap Demands Attention From Analysts

Published 10/28/2019, 06:39 AM
Updated 07/14/2021, 10:35 AM
CME
-
BTC/USD
-

CME Group (NASDAQ:CME) is a global market company that owns numerous exchanges in New York and Chicago. In December 2017, it launched the futures market for Bitcoin (BTC). After its initial success, the group announced that it will launch options trading for Bitcoin in Q1 of 2020.

During the rapid Bitcoin price increase beginning on October 25, the Bitcoin CME futures chart has created a very large unfilled gap from $8800 to $9800. Unfilled gaps are often filled afterward and gaps, in general, often act as reversal points. Additionally, the unfilled CME gap could have been a catalyst for the rapid increase of October 24.

It is possible that the Bitcoin price is likely to decrease and fill the gap before resuming its upward movement. Trader @TheCryptomist outlined this gap in the tweet below.
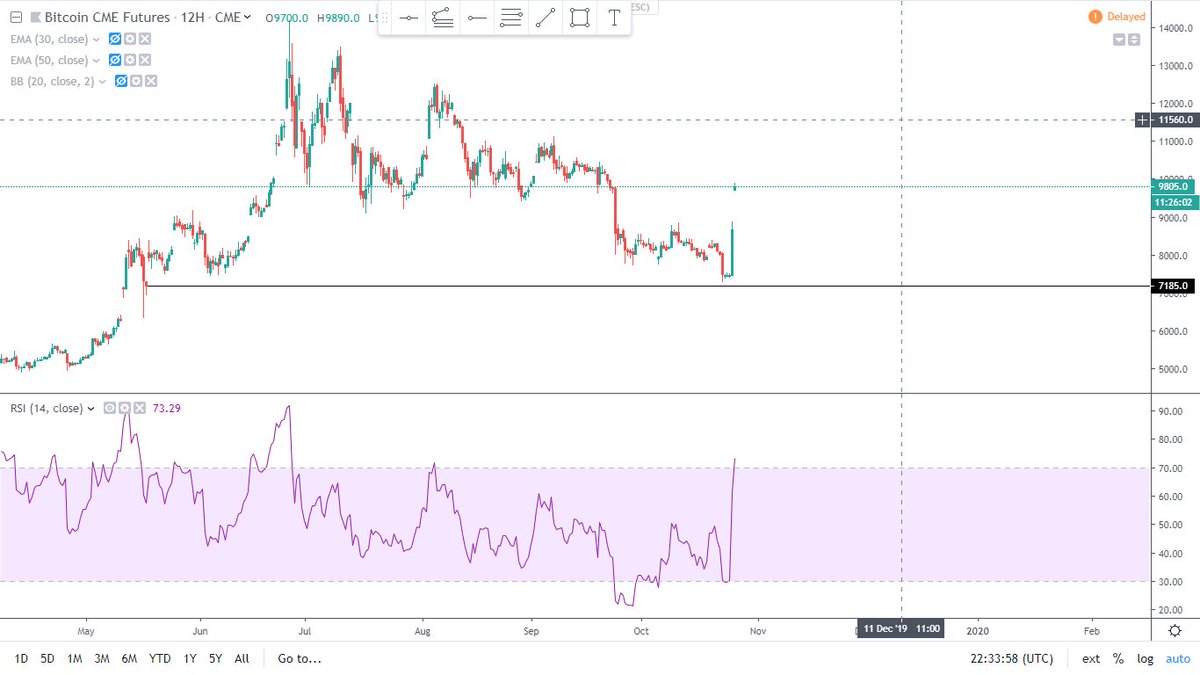
BTC CME Futures Chart

Let’s look at it closely, analyze the type of gap present, and hypothesize on what will it mean for future Bitcoin price movements.

Breakaway Gap

A breakaway gap occurs when the price breaks out from a previous trading range with significant volume.

The current Bitcoin price gap has all the characteristics of a breakaway gap. It had been trading inside of a defined range (a descending wedge) since June 24.
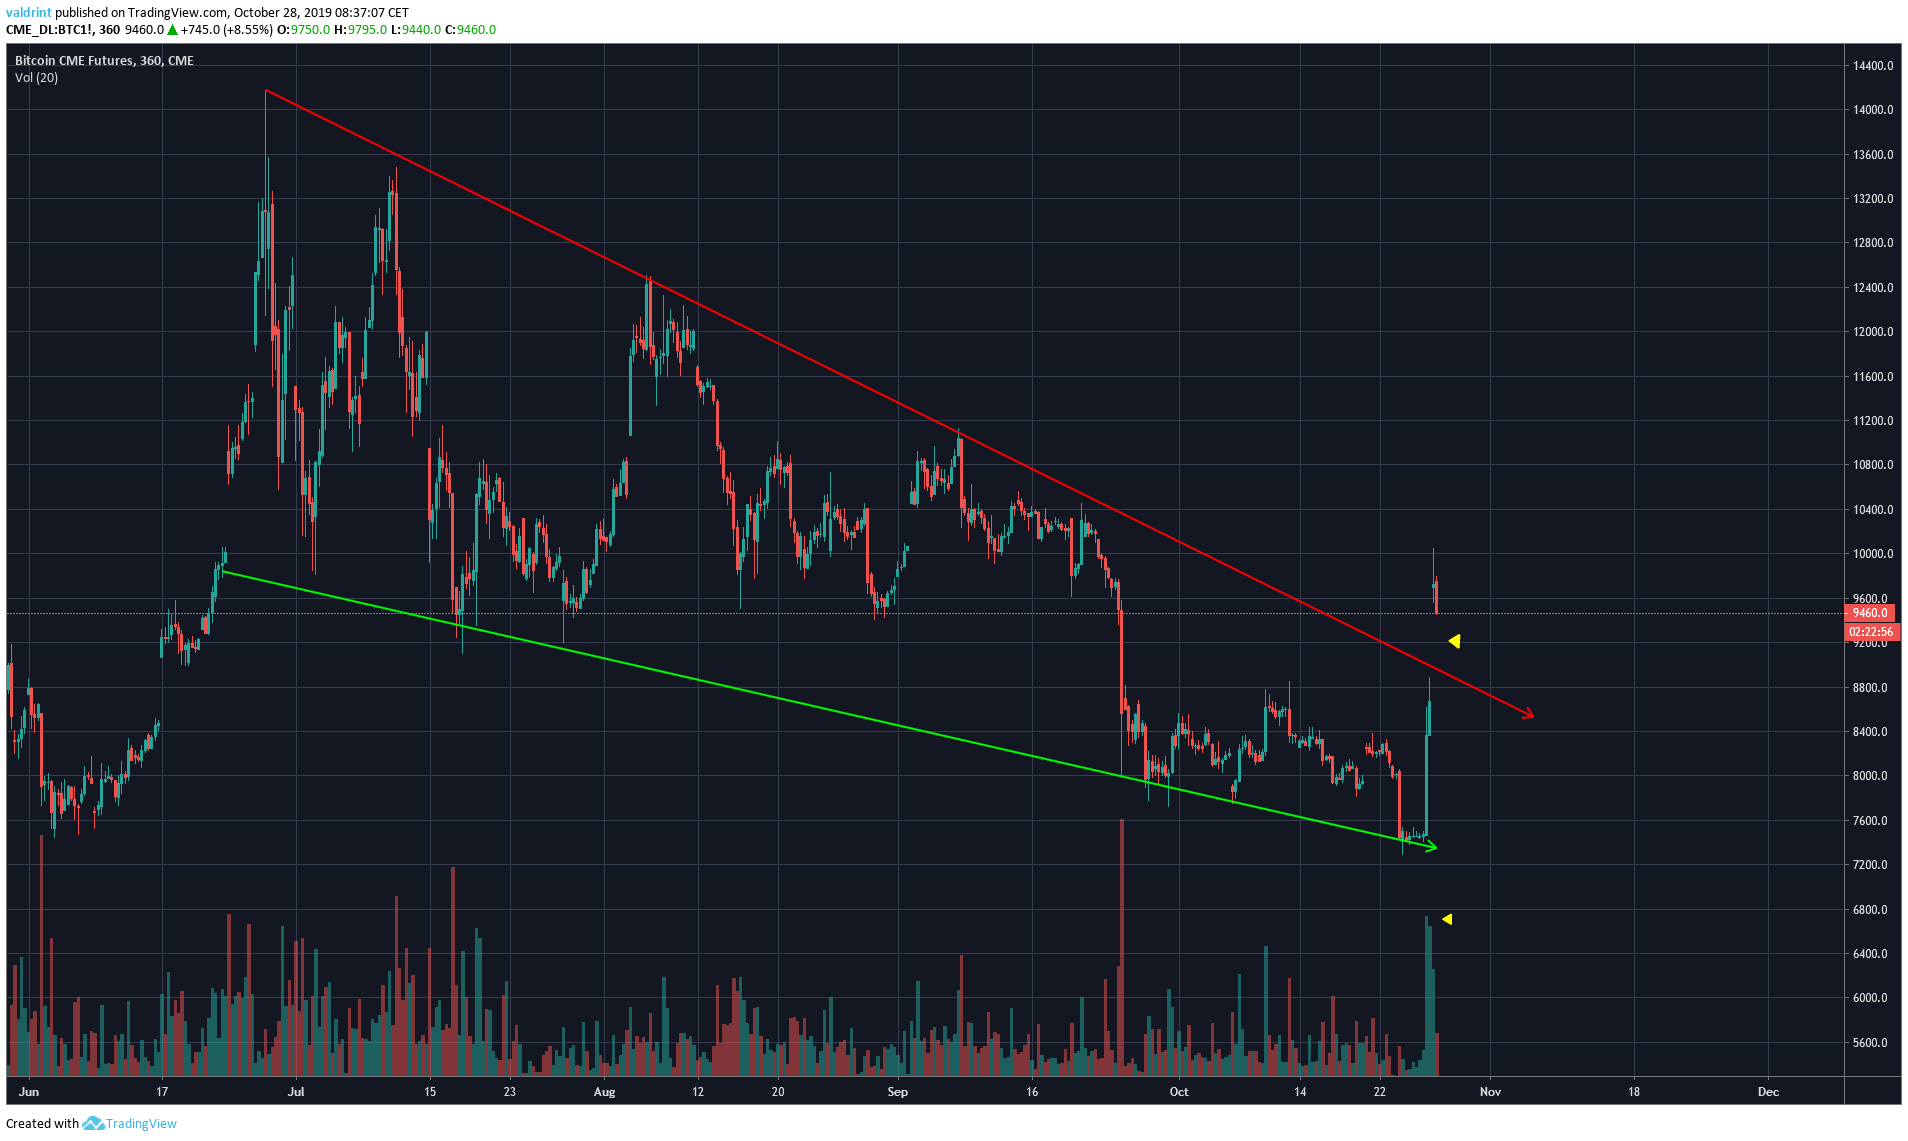
BTC CME Futures Gap Chart

The gap occurred with a very significant level of volume and took the Bitcoin price above the descending wedge. This makes it a breakaway gap.

Future Bitcoin Price Movement

As stated previously, when a gap is left unfilled, a very common movement is to return to those levels in order to fill the gap. In the case of the Bitcoin price, that movement would also coincide with a retest of the previous resistance line — a customary movement in breakouts.
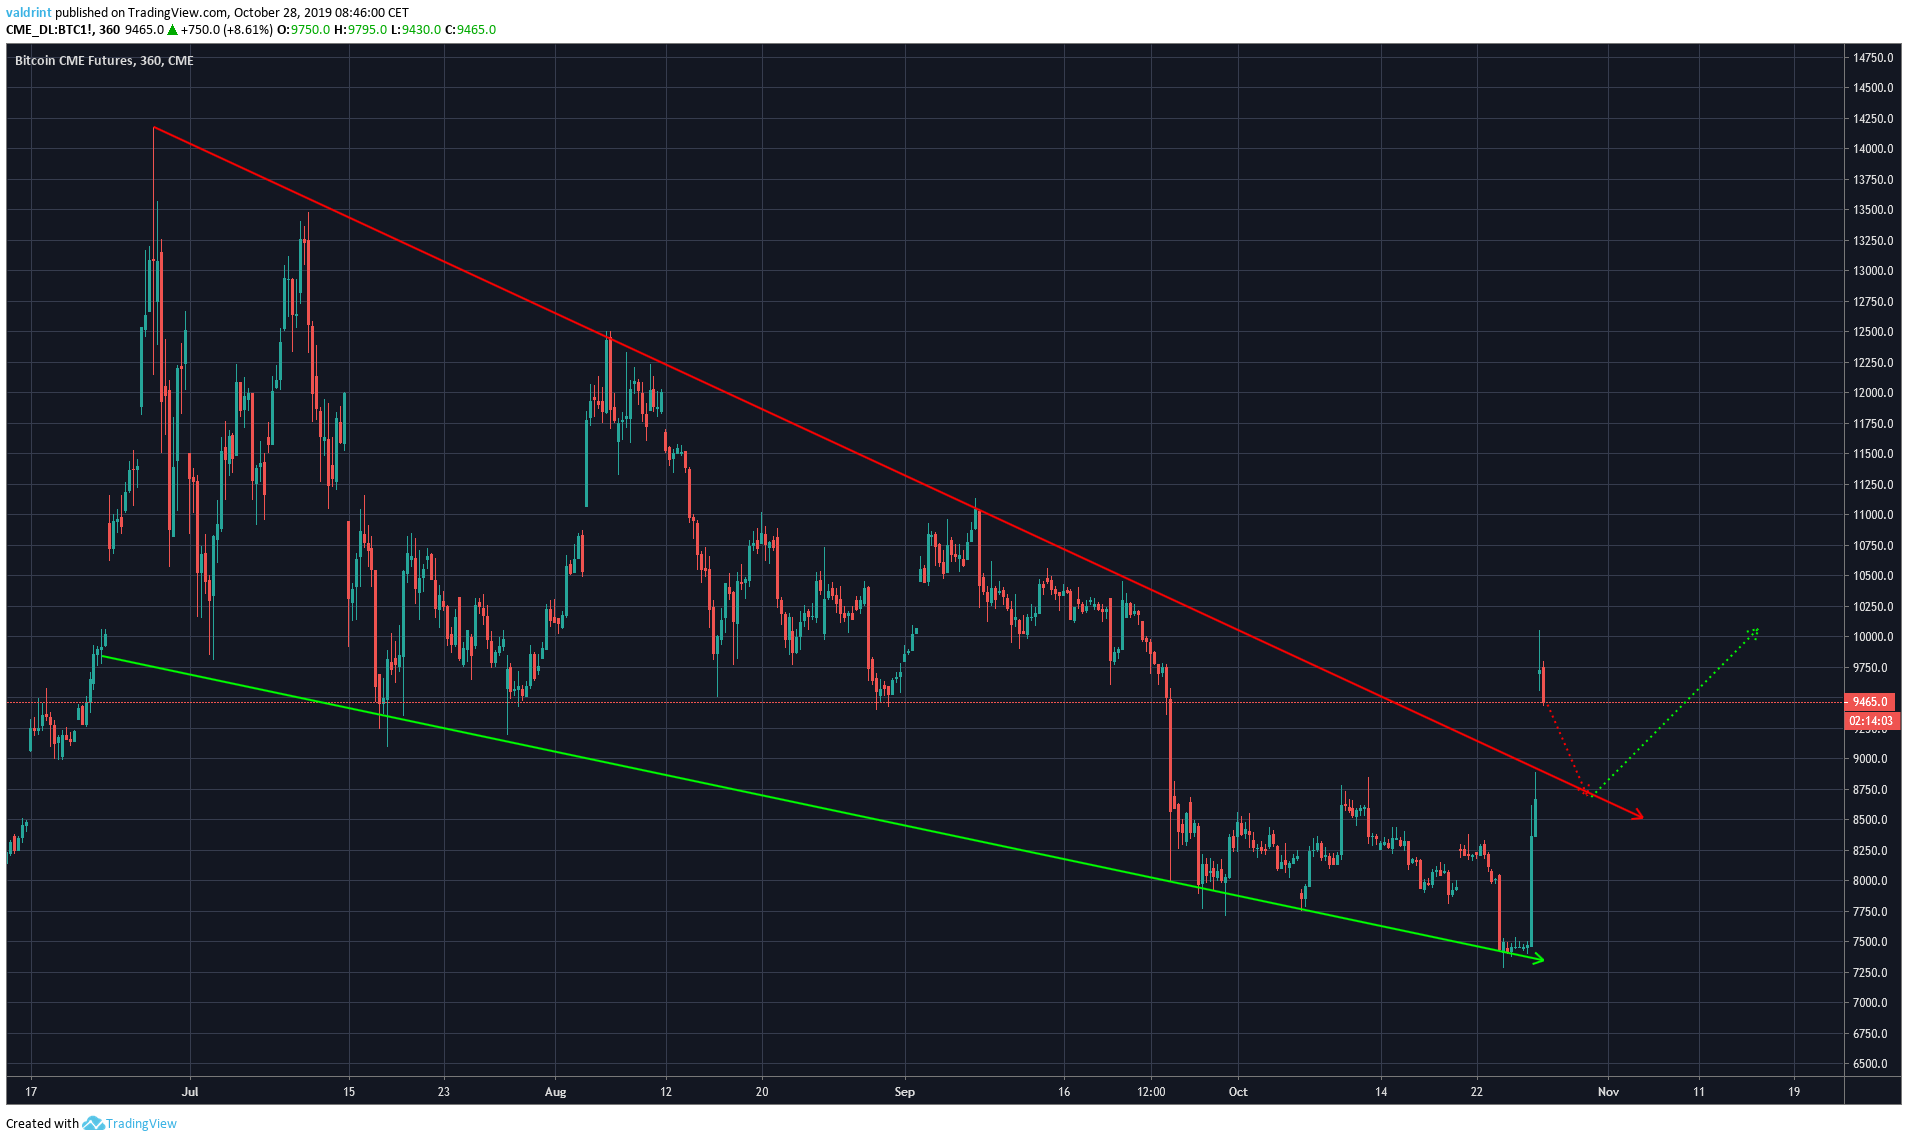
Bitcoin Futures Unfilled Gap Chart

Therefore, we would not be surprised if the Bitcoin price decreased to around $8700 — validating the resistance line before continuing its upward movement.

Latest comments

Loading next article…
Risk Disclosure: Trading in financial instruments and/or cryptocurrencies involves high risks including the risk of losing some, or all, of your investment amount, and may not be suitable for all investors. Prices of cryptocurrencies are extremely volatile and may be affected by external factors such as financial, regulatory or political events. Trading on margin increases the financial risks.
Before deciding to trade in financial instrument or cryptocurrencies you should be fully informed of the risks and costs associated with trading the financial markets, carefully consider your investment objectives, level of experience, and risk appetite, and seek professional advice where needed.
Fusion Media would like to remind you that the data contained in this website is not necessarily real-time nor accurate. The data and prices on the website are not necessarily provided by any market or exchange, but may be provided by market makers, and so prices may not be accurate and may differ from the actual price at any given market, meaning prices are indicative and not appropriate for trading purposes. Fusion Media and any provider of the data contained in this website will not accept liability for any loss or damage as a result of your trading, or your reliance on the information contained within this website.
It is prohibited to use, store, reproduce, display, modify, transmit or distribute the data contained in this website without the explicit prior written permission of Fusion Media and/or the data provider. All intellectual property rights are reserved by the providers and/or the exchange providing the data contained in this website.
Fusion Media may be compensated by the advertisers that appear on the website, based on your interaction with the advertisements or advertisers.
© 2007-2024 - Fusion Media Limited. All Rights Reserved.