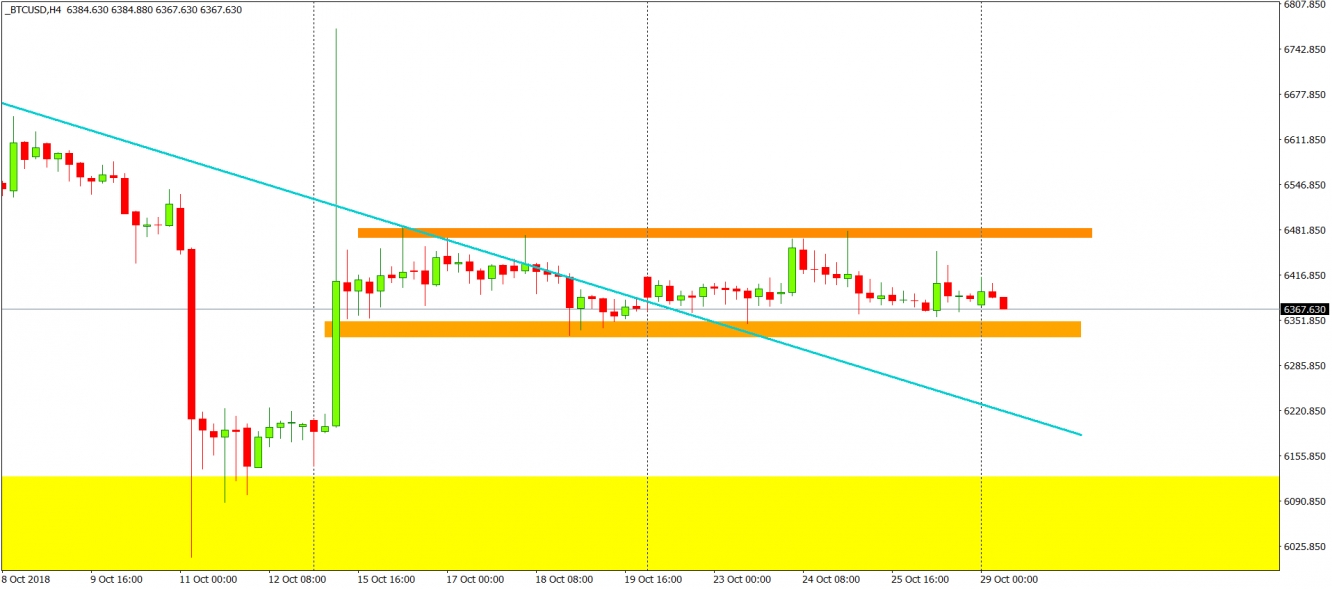
Today, we do have a kind of a funeral here so an analysis of an instrument, which unfortunately died two weeks ago – Bitcoin. On the 15th of October, we had a huge rise (which was later partially retraced) and I think that this took away all the volatility here for the next few weeks. The volatility disappeared completely. One of the most popular feature of the BTC is gone.
The price of this crypto is locked in a rectangle pattern between 6340 and 6470 USD (orange areas). As long as we stay inside of this pattern, we do not have a trading signal yet. The best way to deal with this is to wait for the breakout. The price breaking the upper orange area will give us a short-term buy signal and the price breaking the lower line will give us a sell one. The most important area for the long-term situation is this one marked with a yellow colour, which is the ultimate support for the whole 2018. BTC breaking that level will open the gates to hell.
There is also one important factor here, which we should mention. The blue down trendline. Actually, it is the upper line of the descending triangle pattern. The price broke this, which in theory, should bring us the buy signal. In my opinion, we were just pushed out from the triangle. That was not a breakout, so there is no buy signal. From this formation at least. My outlook on the BTC is rather negative.

