
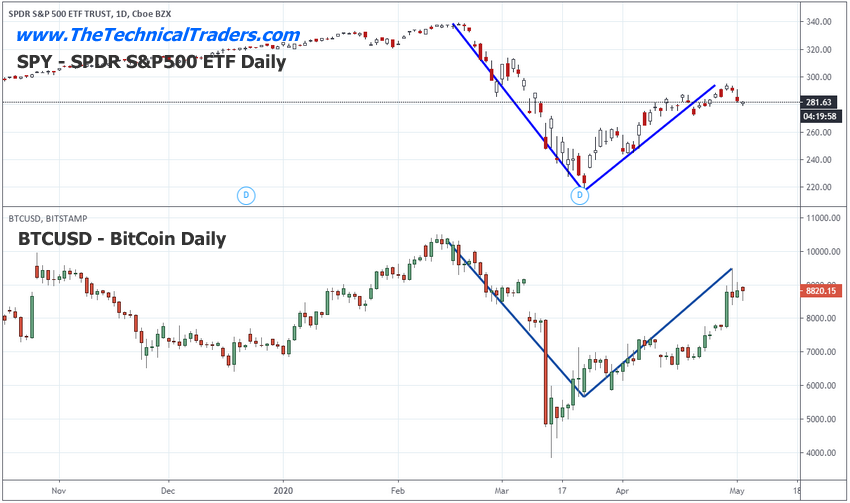
If you pay attention to the trends taking place on the Weekly Bitcoin chart, you'll notice that it has reacted to the global market COVID-19 trends almost exclusively since the beginning of 2020. After the end of 2019, the U.S. stock market rallied on Q4 2019 data and so did Bitcoin (BitfinexUSD). The U.S. stock market peaked near Feb. 20 and began a deeper selloff on Feb. 25. Bitcoin followed this pattern as well. When the U.S. Fed initiated the stimulus on March 23, Bitcoin prices had already started to bottom in anticipation of the Fed stimulus and really began to rally after the Fed began intervening.
Bitcoin Versus S&P 500 Daily Chart Comparison
This is a bit unusual for Bitcoin, which in the past didn't correlate to the U.S. stock market trends all that well. What changed? We believe the sudden correlation of Bitcoin to the U.S. stock market trends are related to investor psychology and the perceived efforts of the central banks in supporting the global economy.
We find it interesting that a decentralized cryptocurrency, which is supposed to be independent of global central banks and governments, suddenly aligns almost perfectly with the U.S. stock market in correlation with the U.S. Federal Reserve. It is almost as if Bitcoin prices are much more aligned with the global economy and global central banks as this crisis event unfolds. This suggests the true value of Bitcoin is not as an alternate, decentralized currency. The true value of Bitcoin is a hyper-speculative alternate store of value – unrelated to any real asset or oversight process.
What's Next for Bitcoin – Weekly Chart
If our research is correct, the current downside price channel (resistance) originating from the June 2019 highs will prompt a massive breakdown in price over the next 5+ weeks – possibly longer. There are two key factors that lead us to this conclusion. First, the correlation to the U.S. stock market, which we believe will continue to move lower until an ultimate bottom is reached near July or August 2020. Second, the massive Fibonacci Price Amplitude Arc inflection point (the GREEN ARC), which will be reached in less than seven days.
If Bitcoin continues to mirror the U.S. stock market price action and this inflection point does what we believe, then a massive breakdown in price may start to trend sometime between May 8 and May 14.
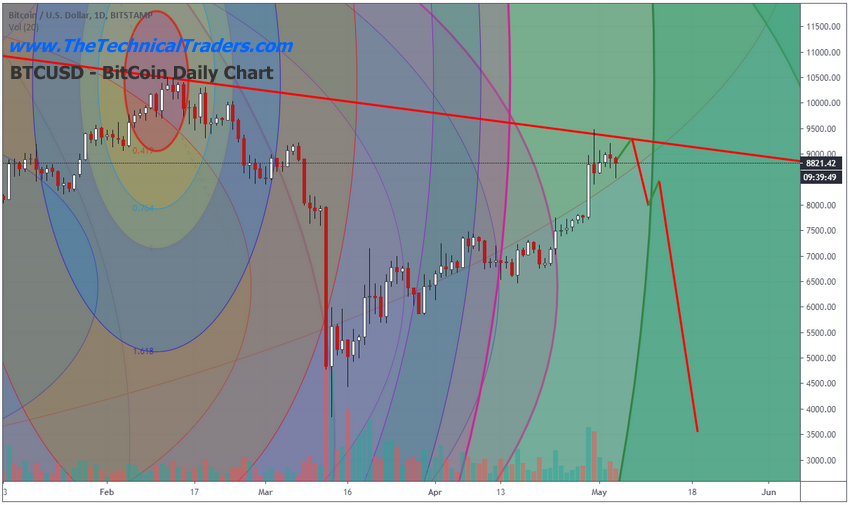
Daily Bitcoin Chart
This Daily Bitcoin Chart shows you what we believe to be the most likely outcome going forward. A bit of upward price rotation to potentially retest the resistance level, then a moderate selloff, followed by a brief sideways trend before an even deeper selloff begins. This may be a map of what the U.S. stock market may do over the exact same span of time.
Concluding Thoughts:
Our researchers believe the ultimate bottom will setup near the end of Q3 2020. We believe general weakness will push the U.S. stock market price towards an ultimate low/bottom near July or August 2020. After that bottom completes, Q4 2020 may see a moderate upside price trend as the Santa rally mode kicks in. If Bitcoin mirrors this move, then it may attempt to move below the $3,850 level and, ultimately, attempt to find a bottom below $3,000.
Our researchers believe Bitcoin has recently aligned with the U.S. stock market and the global central banks. If this is the case, then the “alternate decentralized currency” aspect of cryptos becomes a useless component of the market. If Bitcoin mirrors the (NYSE:SPY) going forward, then it is just an expensive, highly volatile alternate measure of the U.S. stock market and global central bank activities.
Watch for the price breakdown near May 10 or so.