The Extreme Anomaly Of Bitcoin: Is It Sustainable?

Published 10/22/2017, 12:20 AM
Updated 07/09/2023, 06:31 AM
BTC/USD
-
NYXBT
-

After plunging to 3000 six weeks ago, Bitcoin snapped back and reached 6000+ on Friday (a 100% increase during that time), as shown on the following Monthly chart, and, as noted in my last post (originally written on September 4th and updated periodically, with comments and charts, to, and including, today).
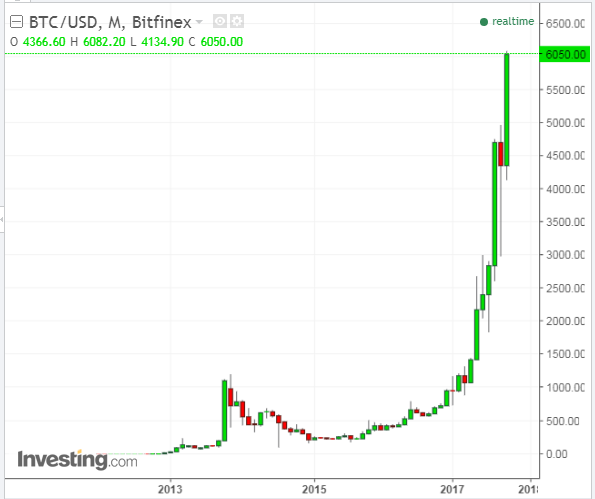
BTC-USD Monthly Chart 2013-2017

What strikes me as extraordinary is to see the percentage gained Year-to-Date of Bitcoin (527.07%) compared to the U.S. Major Indices, as shown on the following graph.

I find this noteworthy and very unusual, to say the least, inasmuch as it's not "backed up by" or "pegged to" anything.
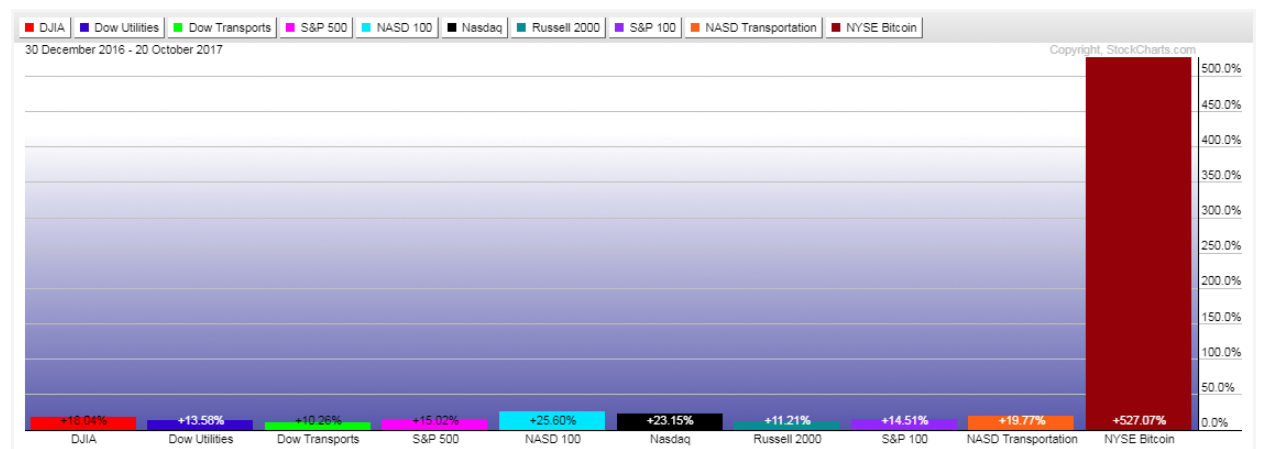
U.S. Major Indices YTD Performance vs Bitcoin

And, here's a look at the all-time percentage gains for Bitcoin, since it was first listed on the NYSE on May 19, 2015...2417.70%...

Is this an unsustainable parabolic bubble in the making? We'll see...
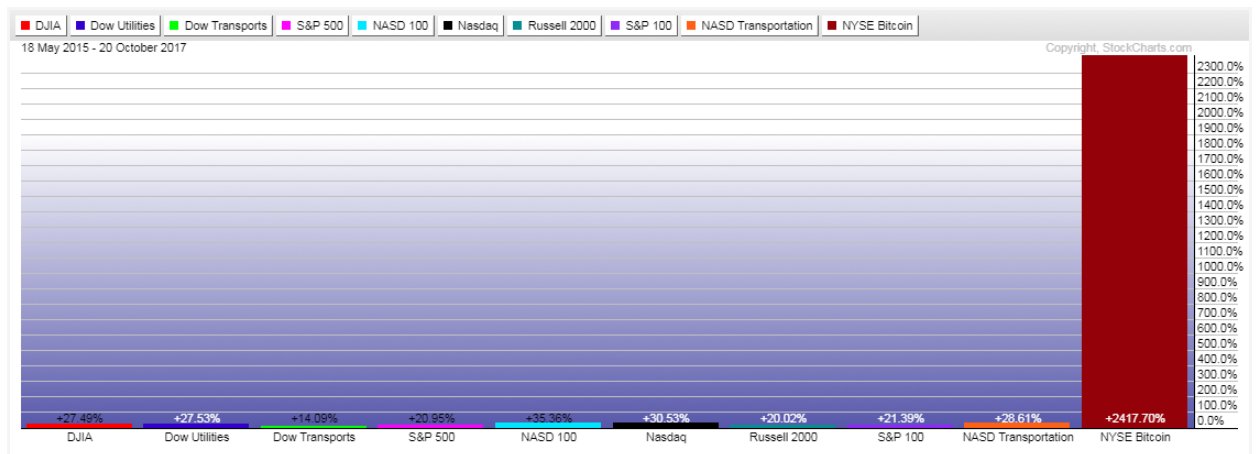
NYSE Bitcoin vs Major US Indices May 2015-October 2017

If Satoshi Nakamoto, the man believed to have created and implemented Bitcoin, still holds 1,000,000 Bitcoin, he'd be $6 Billion richer today. Bitcoin

Latest comments

Loading next article…
Risk Disclosure: Trading in financial instruments and/or cryptocurrencies involves high risks including the risk of losing some, or all, of your investment amount, and may not be suitable for all investors. Prices of cryptocurrencies are extremely volatile and may be affected by external factors such as financial, regulatory or political events. Trading on margin increases the financial risks.
Before deciding to trade in financial instrument or cryptocurrencies you should be fully informed of the risks and costs associated with trading the financial markets, carefully consider your investment objectives, level of experience, and risk appetite, and seek professional advice where needed.
Fusion Media would like to remind you that the data contained in this website is not necessarily real-time nor accurate. The data and prices on the website are not necessarily provided by any market or exchange, but may be provided by market makers, and so prices may not be accurate and may differ from the actual price at any given market, meaning prices are indicative and not appropriate for trading purposes. Fusion Media and any provider of the data contained in this website will not accept liability for any loss or damage as a result of your trading, or your reliance on the information contained within this website.
It is prohibited to use, store, reproduce, display, modify, transmit or distribute the data contained in this website without the explicit prior written permission of Fusion Media and/or the data provider. All intellectual property rights are reserved by the providers and/or the exchange providing the data contained in this website.
Fusion Media may be compensated by the advertisers that appear on the website, based on your interaction with the advertisements or advertisers.
© 2007-2025 - Fusion Media Limited. All Rights Reserved.