The price of Bitcoin has massively corrected in the past few days. However, Bitcoin is about to receive significant support where Bitcoin could bounce off. Bitcoin price prediction – monthly chart looks bullish.
Bitcoin Monthly Chart
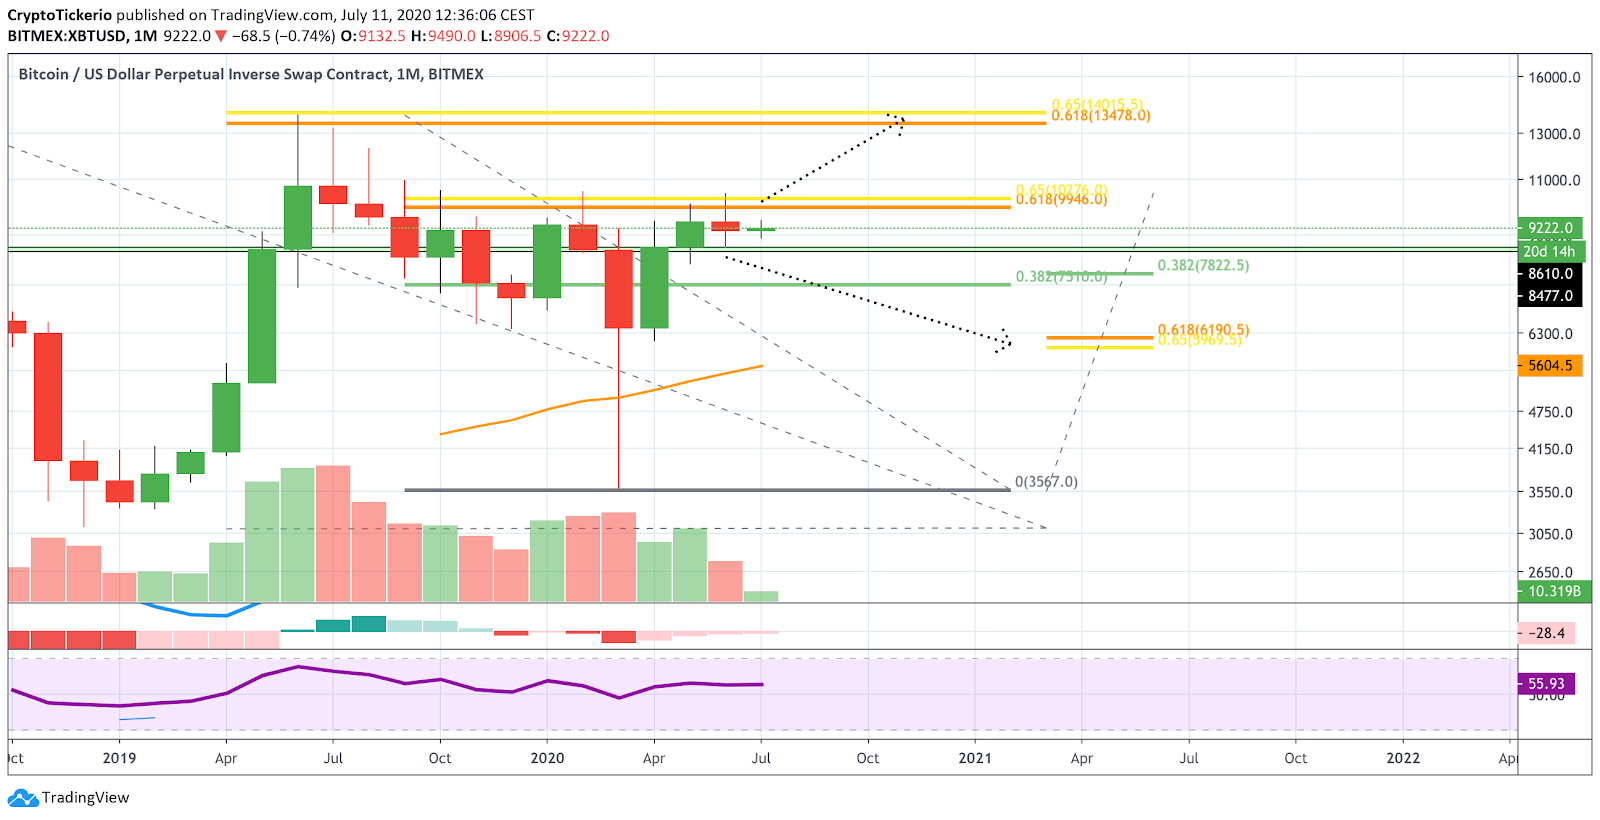
When looking at the monthly chart, the options for the bitcoin price are pretty simple. Either bitcoin breaks the golden ratio at the 10,000 $ mark, or the bitcoin price is rejected at the golden ratio at the 10,000 $ mark. If the 10,000 $ mark is bullishly broken, bitcoin could reach its next golden ratio, at the last significant high at 13,800 $. In the bear scenario, bitcoin could reach as low as 6,200 $, where the next golden ratio is located at. The current monthly candle, which is only a few days away from closing, seems to be directly between the resistance at the 10,000 $ mark and the horizontal support level at 8,600 $.
Slightly below, at around 7,800 $, Bitcoin finds another significant support level. Thus, Bitcoin could find early support at one of those levels to avoid reaching as low as 6,200 $. Furthermore, the RSI gives no bullish or bearish signals.
In contrast, the MACD is giving bullish signals:
First and foremost, the histogram is ticking bullishly higher. Secondly, the MACD lines are about to cross bullishly. Both indicate a continuation of the upward trend in the mid- to long-term. Bitcoin price prediction – weekly chart leans towards supports!
Bitcoin Weekly Chart
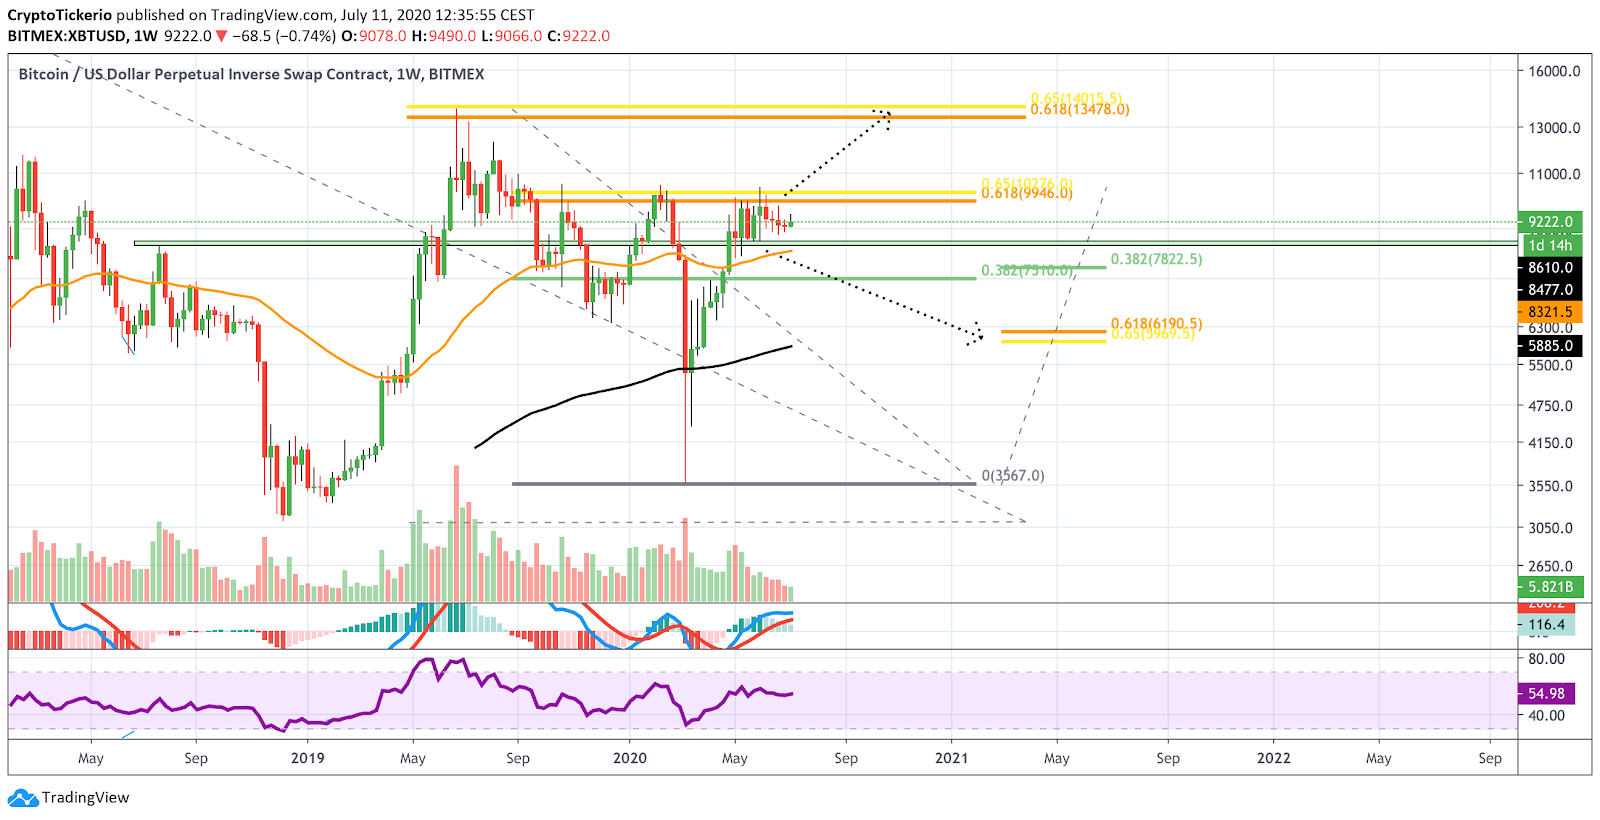
However, when looking at the weekly chart, it should be evident that Bitcoin is about to reach the 8,600 $ support level again. Not only the MACD’s histogram is ticking bearishly lower, but bitcoin topped at the golden ratio at the 10,000 $ mark and was bearishly rejected at this resistance. For now, it seems unlikely that bitcoin will bring enough volume to break this significant resistance. Thus, the weekly chart leans towards bearishness. Bitcoin price prediction – trendline bearishly broken!
Bitcoin Daily Chart
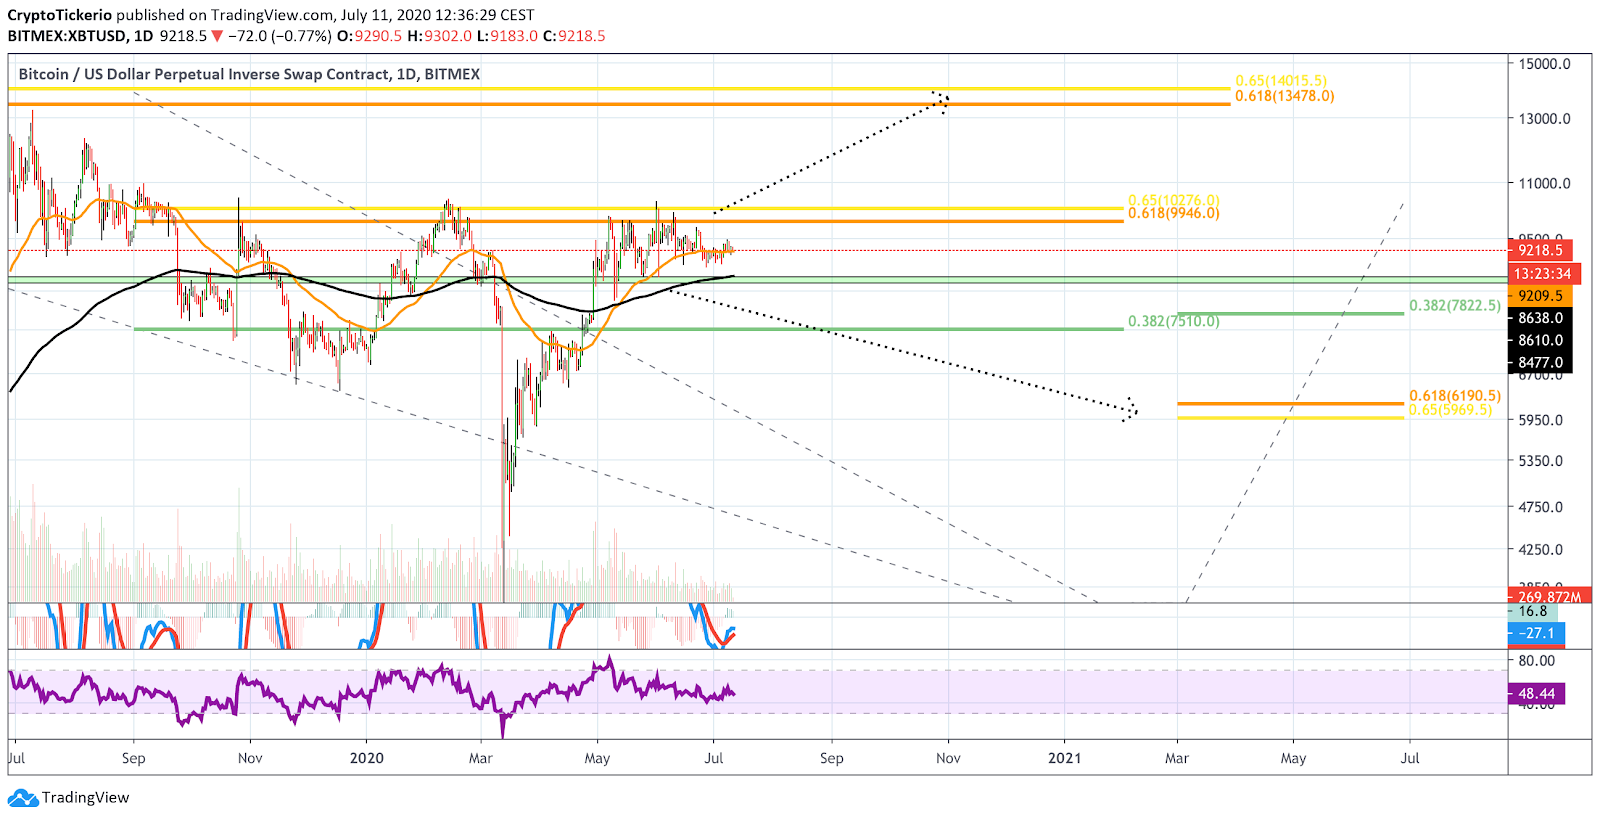
The daily chart is especially bearish. Since the golden cross has happened in May, the bitcoin price could not surpass the resistance. Since the beginning of June, bitcoin has formed a series of lower highs. However, not only that but bitcoin also broke the trendline of the symmetrical triangle bearishly. It seems likely that bitcoin is reaching as low as 8,600 $, where the 200-day-ema acts as additional support. If this level is bearishly broken, bitcoin could fall to the 0,382 fib levels between 7,500 and 7,800.
Once bitcoin’s price has found support, bitcoin should be able to re-test the 10,000 $ mark at the golden ratio resistance. Once bitcoin can break this level (which should happen within this year, since the monthly chart is bullish), bitcoin could surge to the 13,800 $ mark.Bitcoin price prediction – death cross in the 4-hour chart!
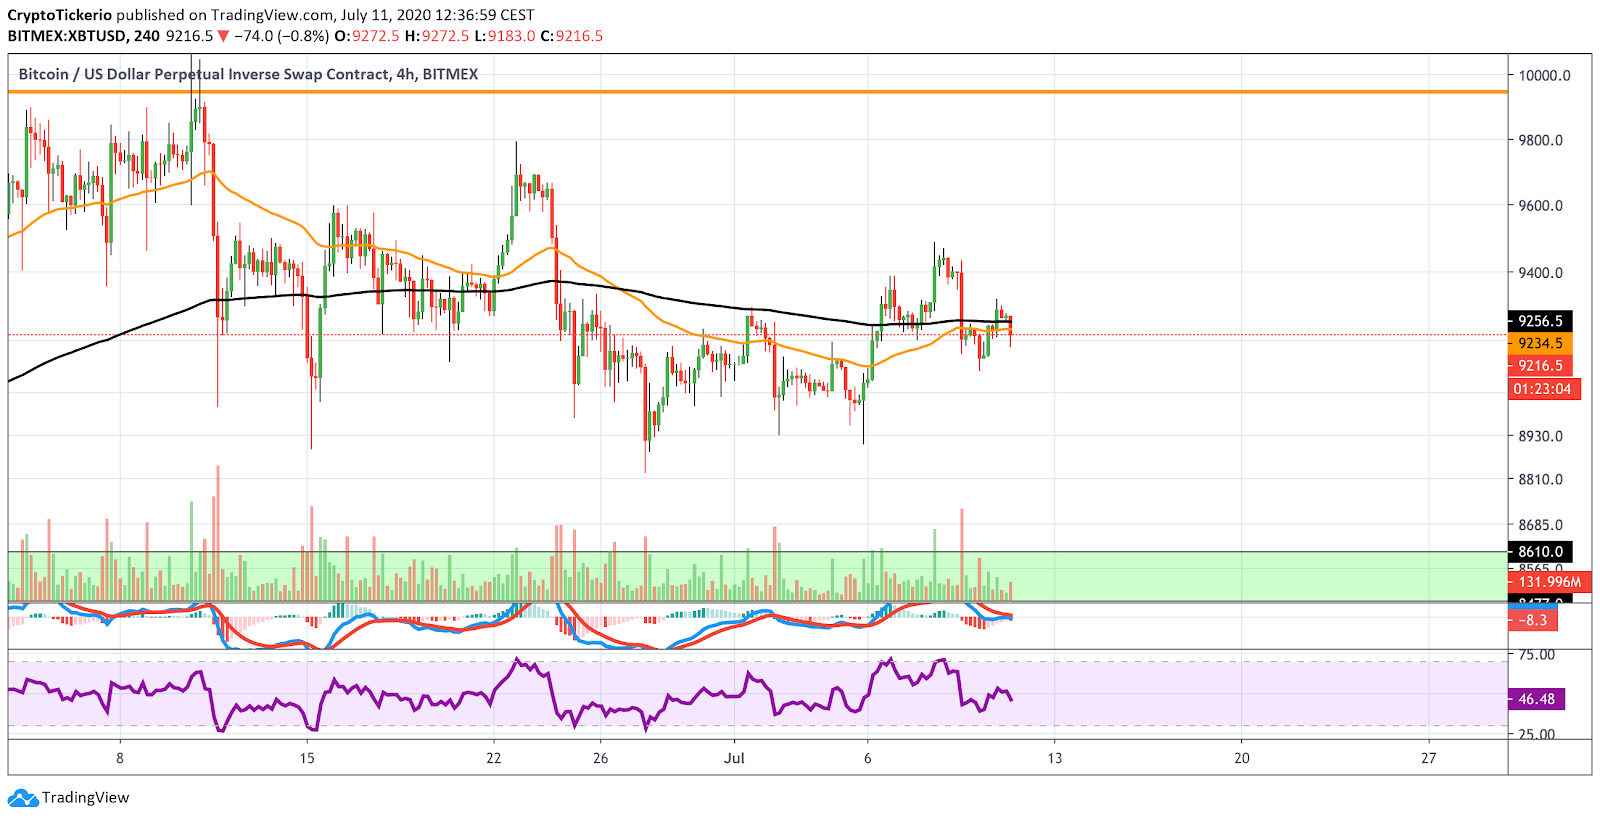
Bitcoin 4 Hour Chart
Nevertheless, for the short-term, one should cautiously pay attention to the 4-hour signal. A death cross appeared here, which typically indicates a continuation of the correction wave towards the downside. Thus, one should prepare for reaching as low as 8,600 $ before looking at bullish prospects for the bitcoin’s price again.
Apart from Bitcoin, new emerging blockchain projects are also making headlines as innovative game-changers. E.g., SaTT or Smart Advertising Transaction Token, a blockchain-based solution that seeks to transform the advertising landscape for both consumers and advertisers, is joining the race. The DaPP SaTT allows anyone to become an influencer and be rewarded in cryptocurrency for their posts on social networks while solving issues in the advertising market such as fraud, speed of transactions, and decentralization.
Moreover, the project is supported by a team of recognized facebook developers from the Atayen Inc Company, the best blockchain marketing agency of the moment Mark chain and supported by several large investors and reputable investment funds such as Richard Wang or Kima Venture with the famous French entrepreneur Xavier Niel.
Stay healthy and trade safely,
Konstantin