On Nov 15, 2018, Bitcoin SV (BSV) and Bitcoin Cash ABC (BCHABC) were born. This marked an important moment in the still continuing Bitcoin Cash Civil War.
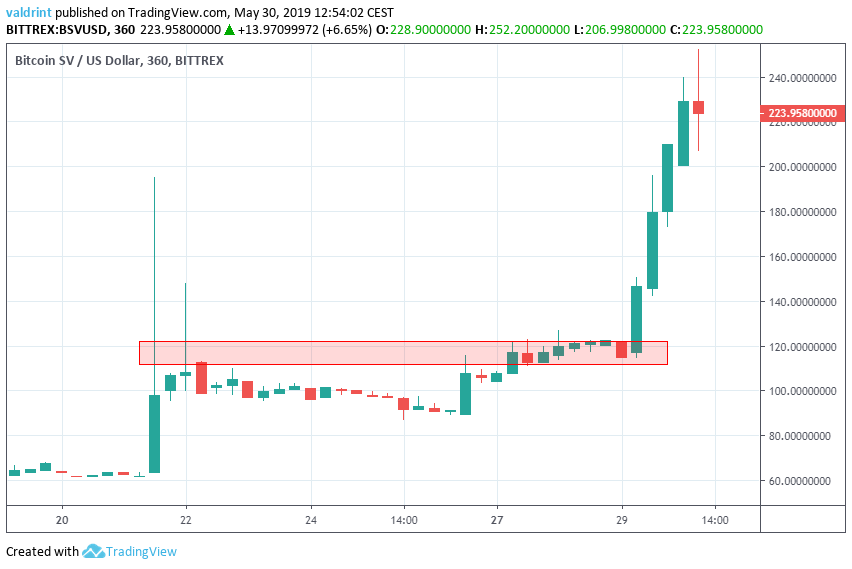
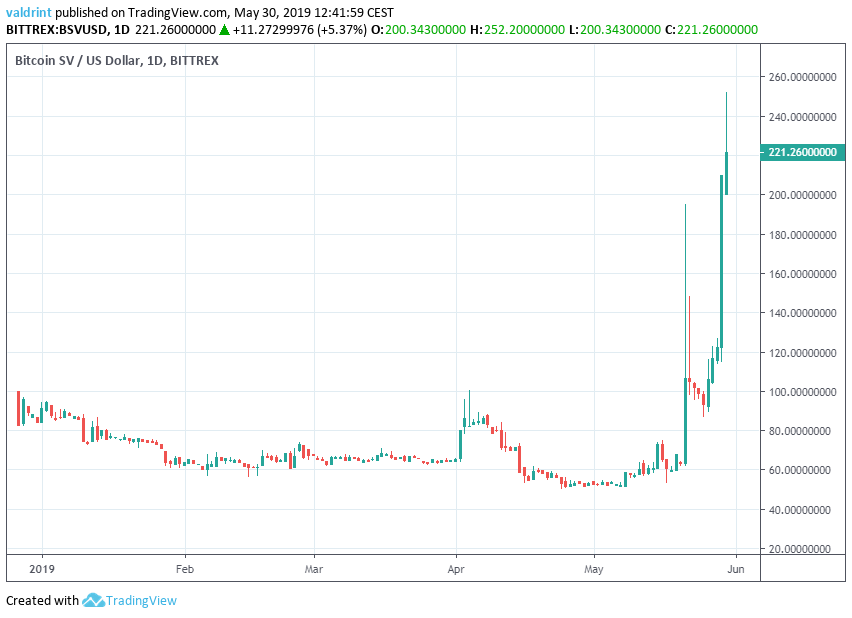
Since the fork, Bitcoin SV has been gradually decreasing. However, on May 21, an upward move began and the price eventually reached a high of $252.2. Price movements are shown in the graph below:
Bitcoin SV (BSV): Trends For May 30, 2019
- BSV/USD began the first upward move on May 21.
- It initiated the second one on May 29.
- It reached a high of $252.2 on May 30.
- It is, possibly, in the fourth wave, based on Elliott Wave Theory.
- Our predicted final high is projected to be around $290.
Initial Upward Move
BSV/USD is analyzed at six-hour intervals from May 19 to May 30. This is done in order to trace the current trading pattern.
On May 21, the price reached a low of $61.91. A rapid upward move began and the price reached a high of $195.00 the same day.
Price movements are shown in the graph below:

After the high of $195.0, the price began to retrace. It created a resistance area near $120.
On May 29, the price broke out from this resistance area, initiating the second upward move.
Second Upward Move
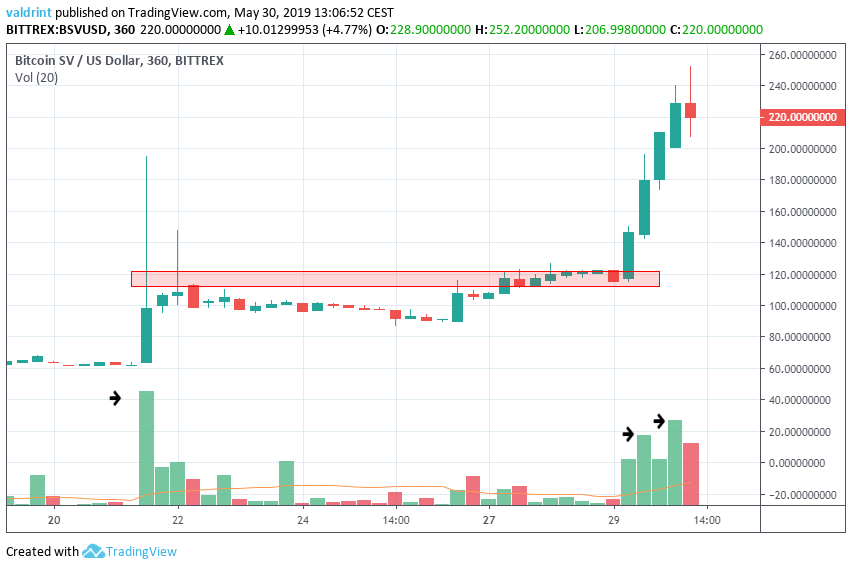
BSV/USD is analyzed at six-hour intervals from May 19 to May 30, alongside volume.
After reaching a low of $115.00 on May 29 the price began an upward move. It reached a high of $252.20 the next day. Afterward, the price began a slight decrease towards $220.0 — where it was trading at the time of writing.

This upward move occurred with significant volume. However, the volume was lower than that of the move on May 21. This is common during the third wave of a five-wave Elliott theory principle. If BSV is indeed following this pattern, after a slight decrease (wave 4), it should begin the fifth wave soon. If it does so, what highs will it reach?
Final Wave?
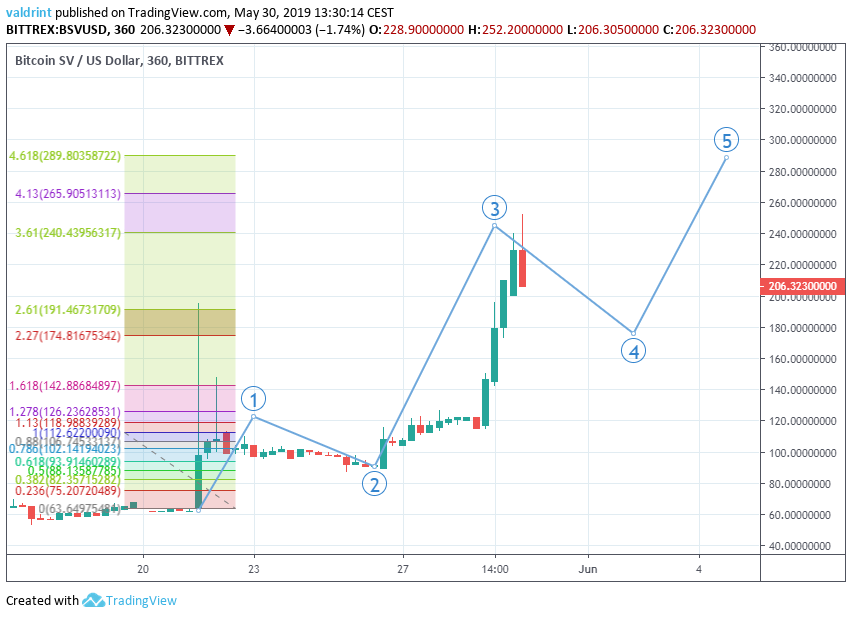
To determine the possible highs reached by the fifth wave, we have used a Fibonacci retracement on the first upward move.
For the top, we used the value of $112, since that is when the initial decrease began.

On May 30, the price reached a high of $252.2 before closing at $238.1. This is in line with the 3.61 fib ratio of the initial upward move. We believe that was the swing high of the third wave. Therefore, we are now in the midst of the fourth wave — which is bearish and should end in the area between $174 and $191, or the 2.27 and 2.61 fib ratios.
Afterward, the fifth wave should reach a high of $290 — which is found by the 4.61 fib ratio of the initial move.
Since the bottom of the fourth wave should be at least as high as the top of the first one, this movement would be invalidated if the fourth wave reaches values below $112.
Disclaimer: This article is not trading advice and should not be construed as such. Always consult a trained financial professional before investing in cryptocurrencies, as the market is particularly volatile.

