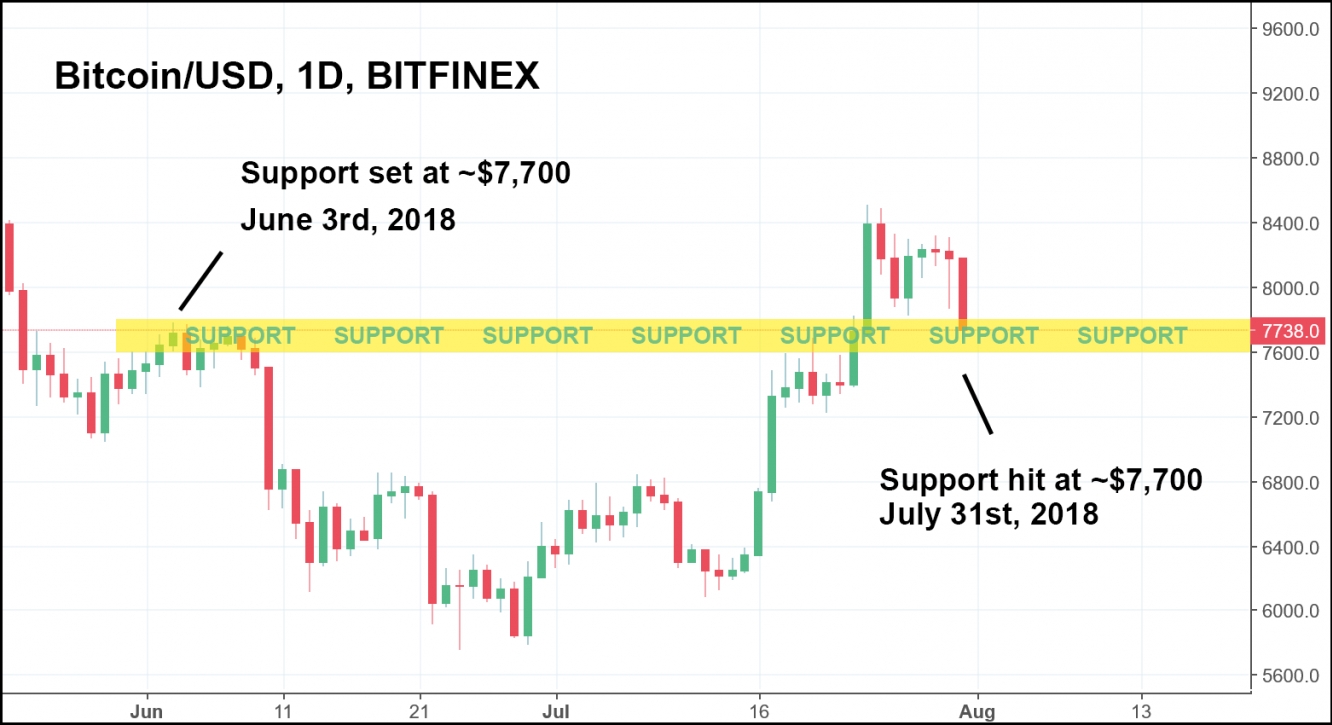
Over the course of trading today, Bitcoin dropped roughly 5 percent to a one-week low at around $7,700. This came after the cryptocurrency’s short burst up to $8,390 last week, and it looks like BTC investors that bought near the bottom might be pocketing some quick gains.
And honestly, I don’t blame them. Bitcoin moved extremely fast – increasing 45% in value since the lows of late June – and any time investors get that kind of price action in such a short window, the other shoe is bound to drop eventually.
But that’s nothing to be worried about if you’re a long-term Bitcoin HODLer. Sell-offs are a natural, healthy part of an up-trend that are essential to cryptocurrency’s (or any other security’s) sustained growth.
Today’s dramatic dip may have surprised many investors, but if you were watching the charts intently, you might have seen this coming a few days in advance.
Because as Bitcoin started to tumble back on July 25th, it was veering towards a collision with support set all the way back in early June.
You can see in the daily BTC/USD chart above that Bitcoin slammed right into the support level at roughly $7,700, which was established on June 3rd right before prices took a plunge.
And honestly, compared to some of the other single-day losses Bitcoin has endured, 5% is small potatoes.
However, it can still be worrying if you got long on BTC near $8,400 – so let’s take a look at the different scenarios that could play out from here:
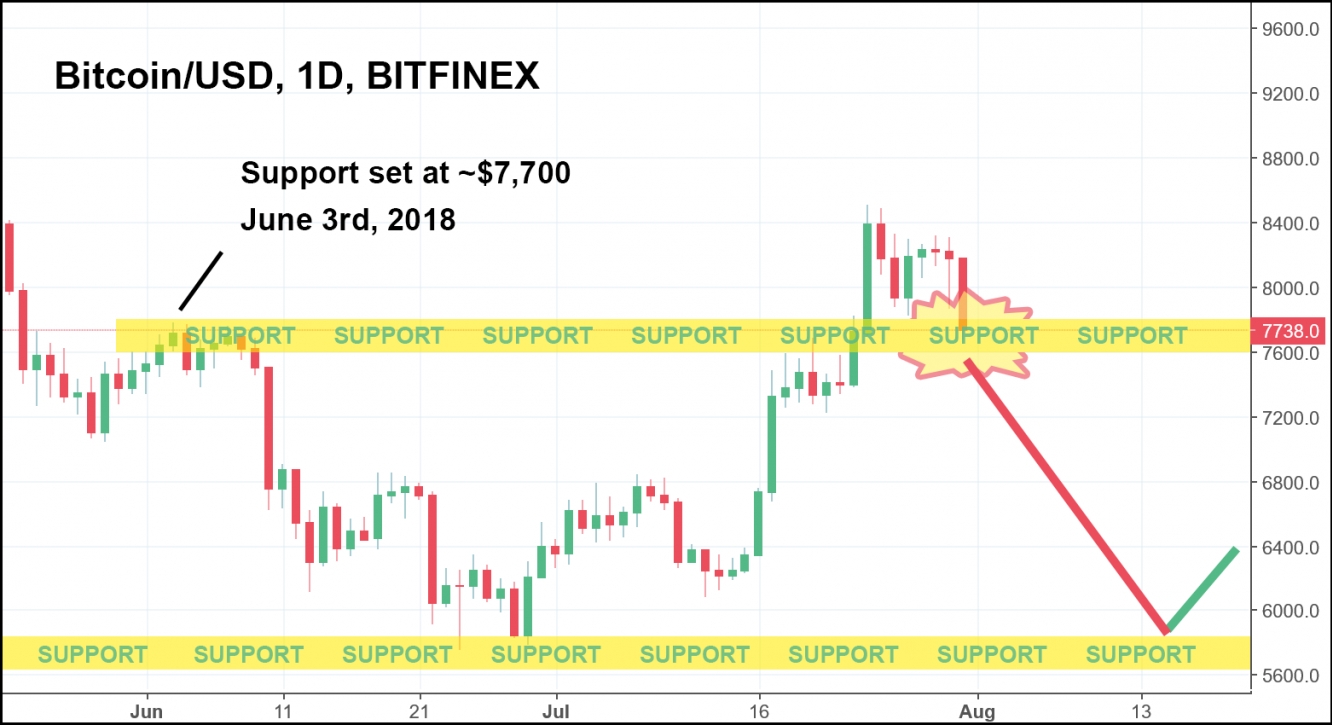
1. Bitcoin blows past support, screaming downwards towards $5,700
Oops! Instead of bouncing off support at $7,700, Bitcoin takes a nosedive all the way down to the lowest level of support at $5,700, before rebounding back up. From there, Bitcoin would likely make another run at the $8,000 range.
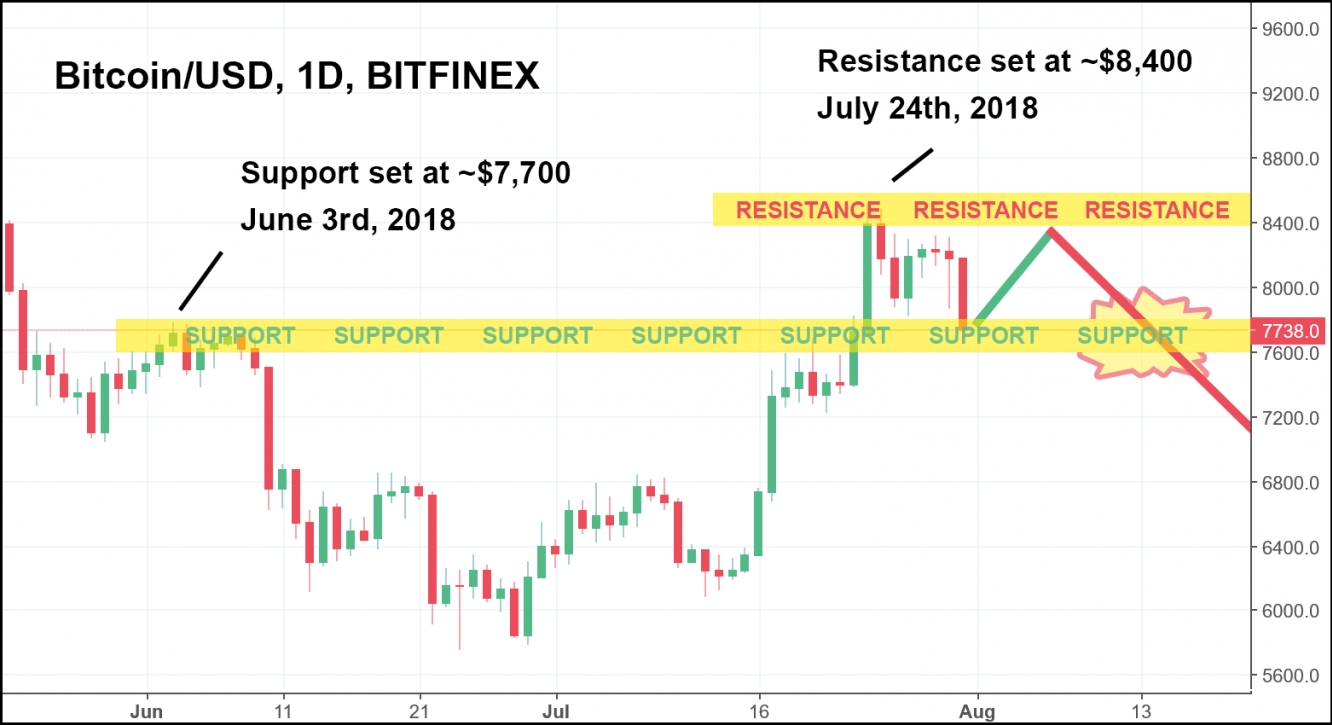
2. Bitcoin jumps back up to resistance at $8,400 before trailing back down past support at $7,700.
In this scenario, Bitcoin recovers slightly but ultimately can’t surpass the resistance level set at $8,400. It forms a “double top” (a major sign of a trend reversal) before plummeting past support, condemned to trading purgatory for the next few months.
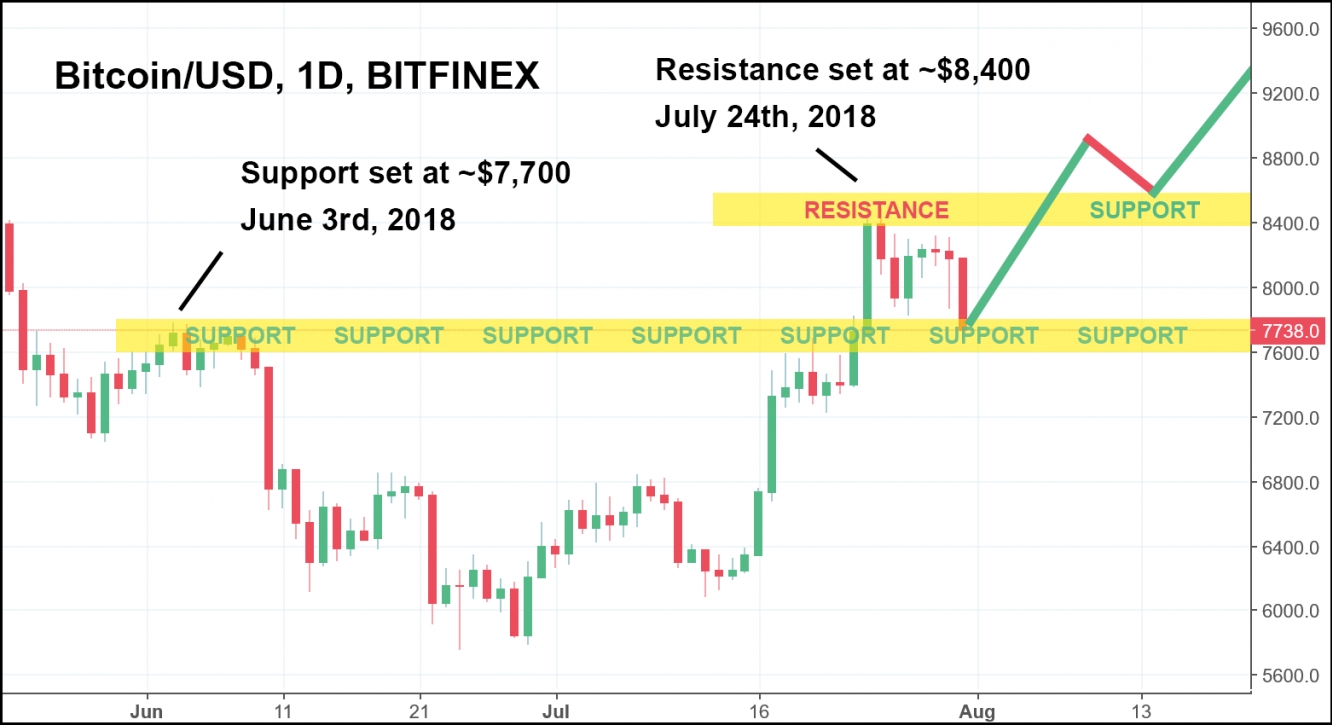
3. Bitcoin surpasses resistance at $8,400 and creates new support, using it as a launch-pad for a continued uptrend.
In our last scenario, Bitcoin shoots up past resistance before a short-lived sell-off back to resistance, which has now become support. From there, Bitcoin continues its climb to the top, setting new, higher highs in the process.
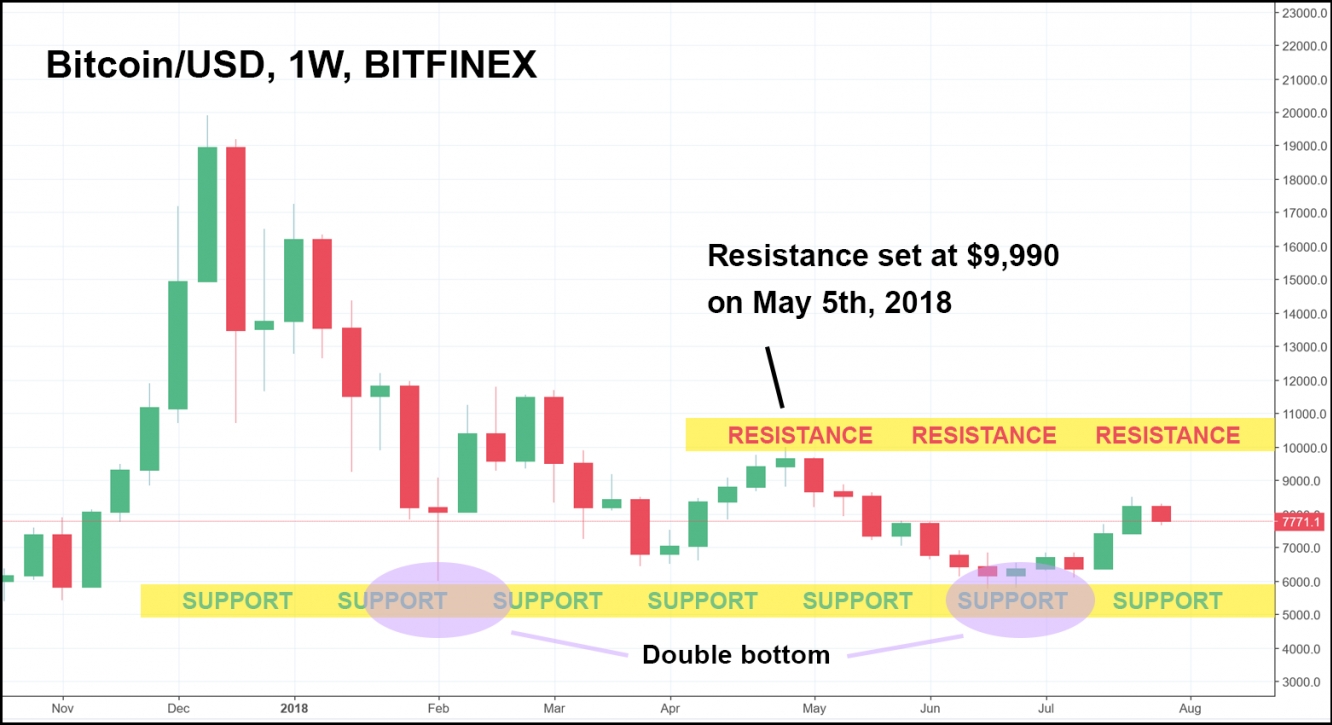
Out of all three of these situations, I firmly believe that this one has the best chance of happening. It can be hard to see why I’d think that when we’re this zoomed in on a chart with daily candlesticks, so let’s take a longer-term look at what Bitcoin has done so far in 2018.
You can clearly see that while Bitcoin may be targeting resistance at $8,400 on the daily candlesticks, it’s got much bigger fish to fry on this weekly BTC/USD chart – needing to climb past resistance set back in early May at $9,990.
And while naysayers will claim that Bitcoin looks like it’s in the process of setting a lower high this week, I’d say that the formation of a “double bottom” (that was almost a triple bottom) is much too strong of an indicator of a full-fledged trend reversal. We’re seeing that play out now, with daily price action that has resulted in the setting of consistently higher highs – something that only happens in an uptrend.
So, as we move ever forward towards the great unknown that is Bitcoin’s future, just remember that simply studying levels of resistance and support can sometimes be enough to paint a clearer picture of what’s to come. Technical traders often get hung up on fancy indicators, paralyzing themselves with over-analysis – when all they had to do was just look at what’s happening on the charts.
I tend to get caught in that trap as well – there’s no shame in it. Whenever it does happen, though, I try to remind myself of the old investing adage that will always hold true:
Trading is simple, but it isn’t easy.

