The last several months have been unusually quiet for the price of Bitcoin. The largest cryptocurrency first touched the support area near $6000 in February and has been testing it multiple times since. This support looked so strong for so long that traders and investors started believing BTC/USD was getting ready for the next major bull leg.
It wasn’t meant to be, though. Yesterday, Bitcoin finally made a decisive breach below $6000. The price fell to a new low of $5324 on November 14th and is still hovering around $5400 as of this writing. According to crypto experts, the plunge was caused by concerns about the upcoming “hard fork” of the Bitcoin Cash network.
The only problem we have with that explanation is that, as usual, it comes after the fact. Unfortunately, traders cannot turn back time and take a defensive position now. That is why we always try to prepare for a market move before it happens, instead of explaining why it happened afterwards. And Elliott Wave analysis makes this possible.
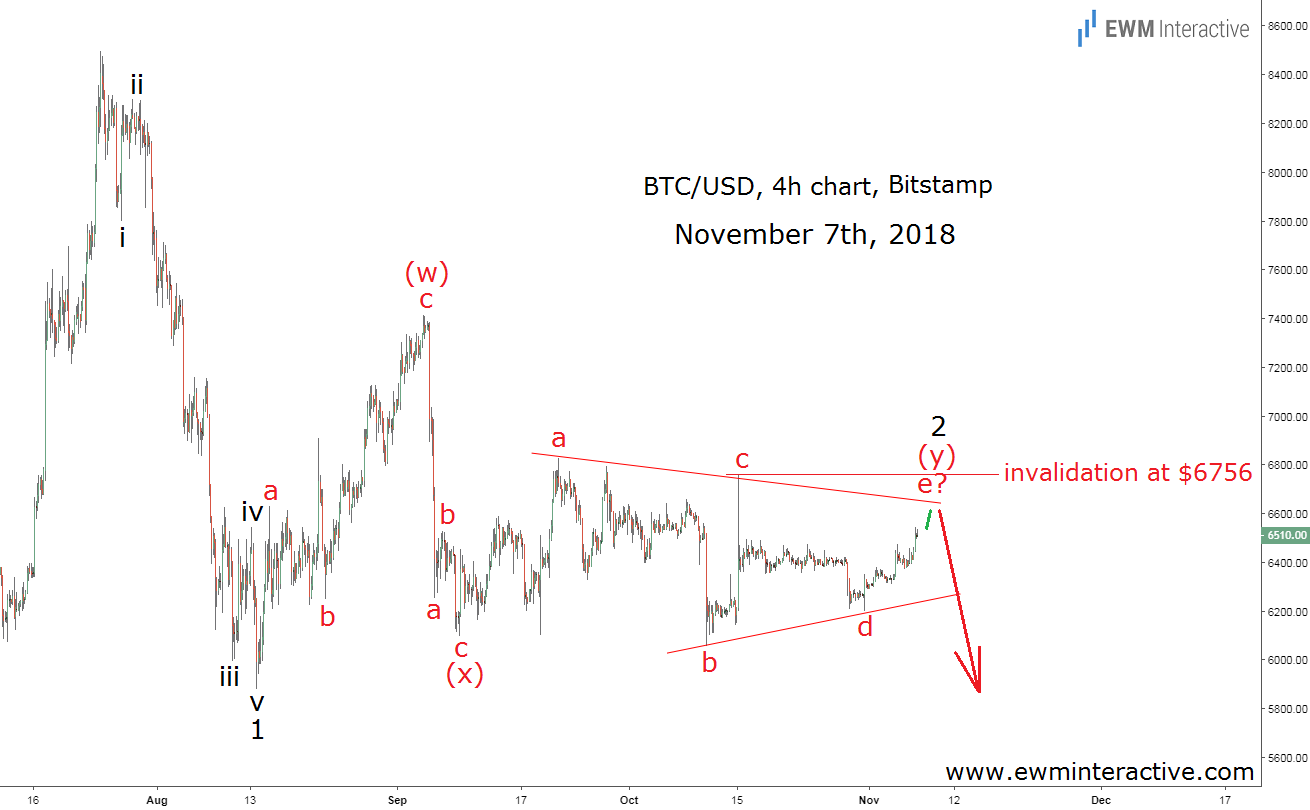
Our premium subscribers received the following chart as a short-term update on Wednesday, November 7th. It shows that there was a way to predict Bitcoin’s plunge and it has nothing to do with the hard fork in Bitcoin Cash.
Elliott Wave analysis is all about pattern recognition. It takes time and persistence, but after a few months of practice a dedicated student can begin to recognize the repetitive patterns the market keeps drawing on the price charts.
Rare Elliott Wave Pattern Sends Bitcoin into a Tailspin
For instance, the decline between $8497 and $5880 had the shape of a textbook five-wave impulse, labeled i-ii-iii-iv-v in wave 1. According to the theory, impulses point the direction of the larger trend. An impulse to the south suggested BTC/USD was still under bearish jurisdiction. On the other hand, every impulse is followed by a three-wave correction in the opposite direction, before the larger trend resumes.
And that’s where things got really interesting for us, because wave 2 was not just an ordinary correction. It could have been just a simple a-b-c recovery and end at $7412 in September, but the market had something a lot more complicated in mind.
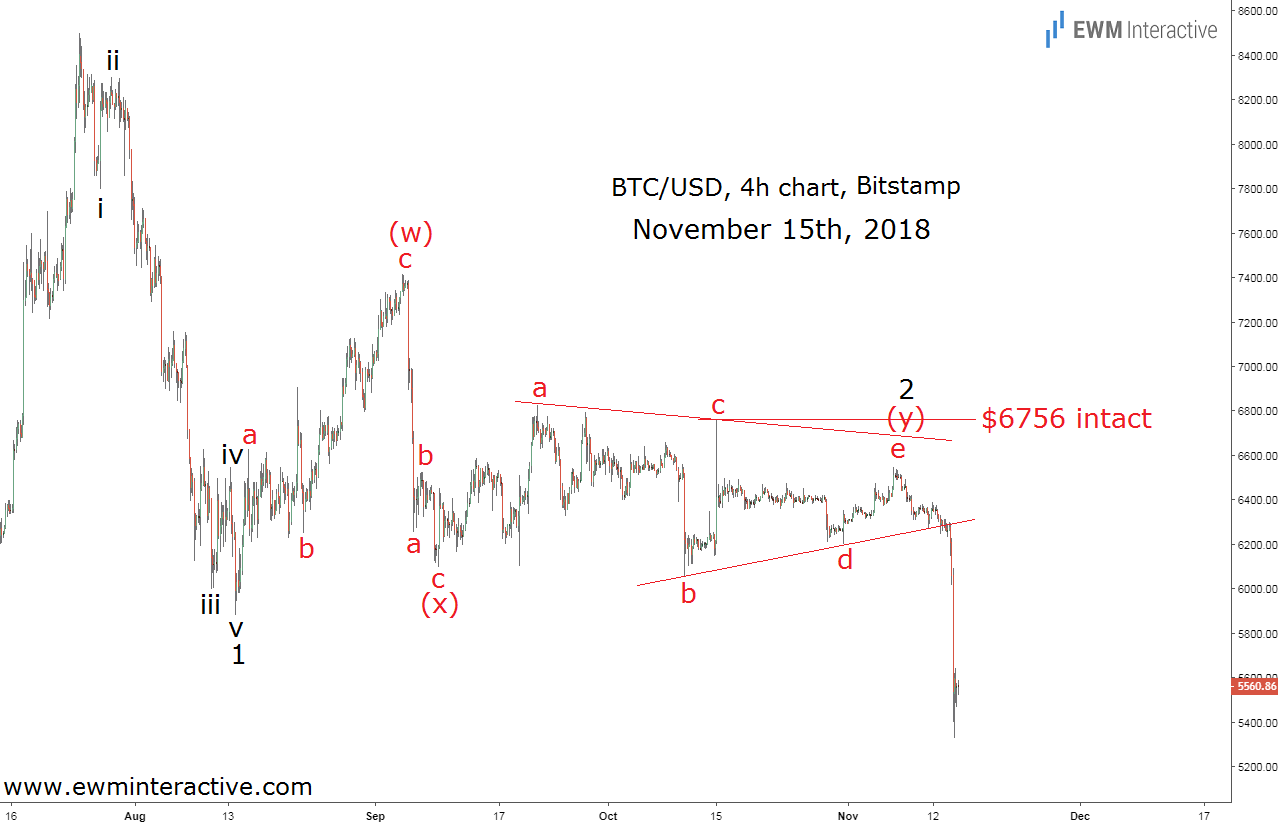
On November 7th, wave 2 looked like a (w)-(x)-(y) corrective combination between a simple zigzag in wave (w) and a triangle in wave (y). As visible, despite a very time-consuming wave 2, the five-wave decline in wave 1 kept the negative outlook valid the whole time. Wave “e” of (y) was not supposed to exceed the top of wave “c”, which meant $6756 was our invalidation level for this count. The updated chart below shows how the bulls got slaughtered yesterday.
The bulls never threatened $6756. The selling pressure kept mounting until the lower line of the triangle eventually gave up, opening the way for a spectacular selloff. The price of Bitcoin is down by almost $1200 since November 7th, crushing the bulls’ faith in the $6000 support.
Don’t Extrapolate!
Bitcoin once again demonstrated that nothing lasts forever in the markets. Extrapolating the recent past into the future must be the worst trading strategy of all. Investors, who thought “$6000 has been holding for months, so it will keep holding in the future“, are now sorry for it.
Fortunately, there is another way to look at things – the Elliott Wave way.
