The price of Bitcoin slightly breached the psychological level of $3500 yesterday and still has not been able to escape its gravity as of this writing. The current selloff brought back the memories of the time when BTC/USD fell to $3122 a month ago.
And while in the markets everyone is an expert in retrospect, the question really worth discussing is how could traders prepare in advance for this decline in the market’s increasingly uncertain environment?
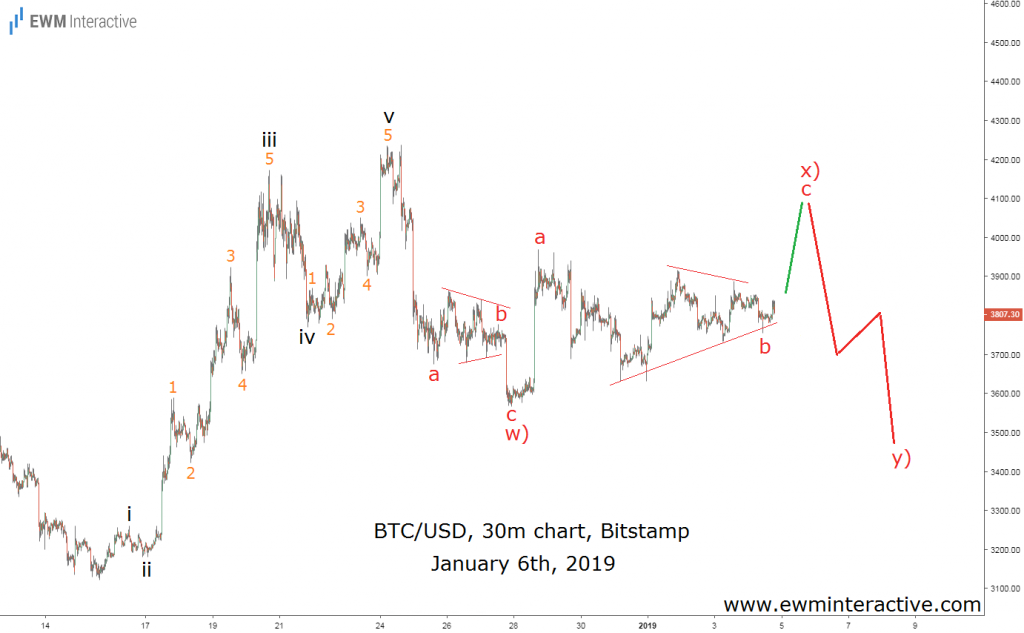
We cannot speak for everyone, but our way of dealing with uncertainty involves Elliott Wave analysis. For instance, our subscribers received the following chart on Sunday, January 6, when Bitcoin was still hovering around $3800.

The 30-minute chart of Bitcoin against the U.S. dollar revealed that even though its fourth wave was bigger in relation to the second, the rally from $3122 to $4237 could be seen as a five-wave impulse, labeled i-ii-iii-iv-v.
An Alternative Count In Mind
According to the theory, a three-wave correction in the other direction follows every impulse. Here, our primary count suggested the drop from $4237 to $3566 was a simple a-b-c zigzag, which completed the whole 5-3 wave cycle.
On the other hand, the alternative count, shown above, acknowledged the possibility that the recovery from $3566 might be only wave x) of a larger w)-x)-y) double zigzag, which was still in progress.
Under this scenario, Bitcoin was also looking bullish in the short-term, but the resistance near $4100 was going to be a tough nut to crack for the bulls. Caution was advised in that area. Less than three days later, BTC/USD had already reached it.

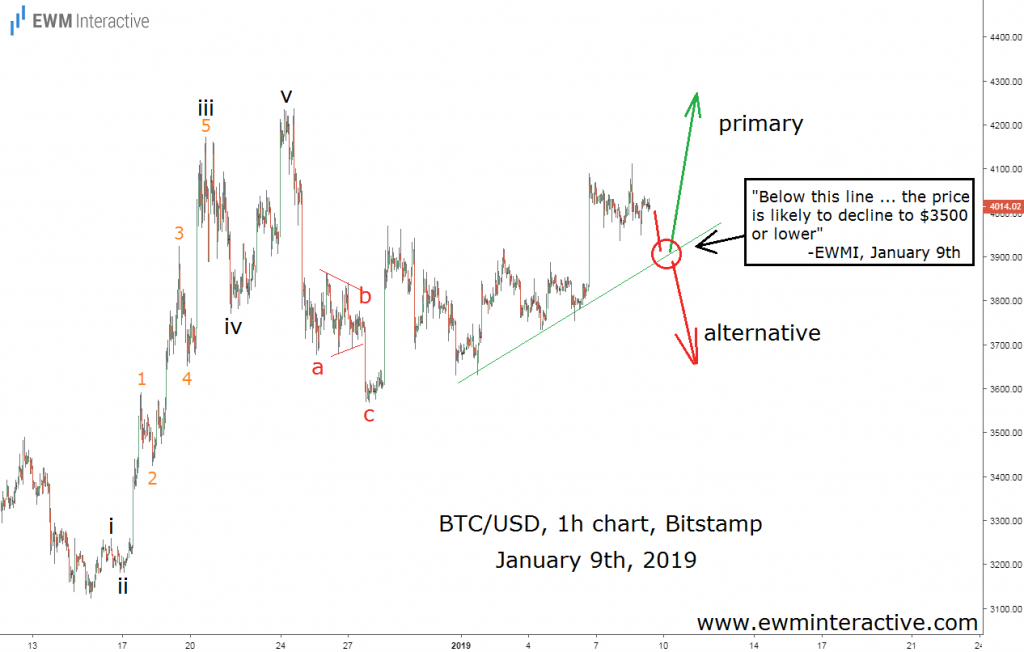
Bitcoin climbed to $4112 on January 8. The chart above was sent to our subscribers as a short-term update the very next day, January 9.
There was clearly no point in pretending that we knew what was going to happen. Both the positive and the negative outlook were still possible, so our only option was to keep both in mind and find something to tell us when the odds have tilted in favor of one of them.
A Single Line Made The Difference For Bitcoin Traders
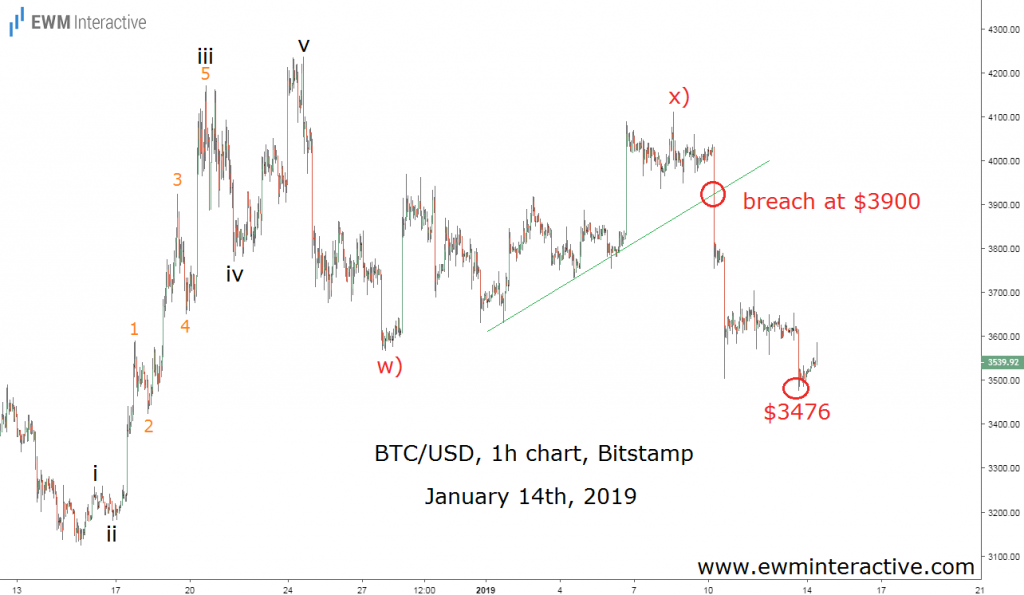
The green support line drawn through the last three swing lows seemed important. A bearish breakout there would invalidate the bullish outlook and in the same time confirm the bearish alternative. Our opinion was that “below this line … the price is likely to decline to $3500 or lower.” Then this happened:

The price of Bitcoin breached the rising line of support on January 10 and put the bears in the driving seat with targets around $3500. BTC/USD fell to $3503 the same day and to $3476 on January 13th.
“Uncertainty” is practically synonymous with “markets.” Ever since trade exists, there has never been anything certain for market participants. A hard lesson was to be learnt by those who at one time or another thought they were guaranteed to make money.
Fortunately, the way Bitcoin has been developing in the last week proves that traders can prepare even though they cannot know.
