On July 15, 2019, the Bitcoin price reached a low of $9991. A gradual increase ensued. The next day, BTC reached highs over $11,000. However, a rapid decrease followed and the price decreased by more than 15 percent the same day.
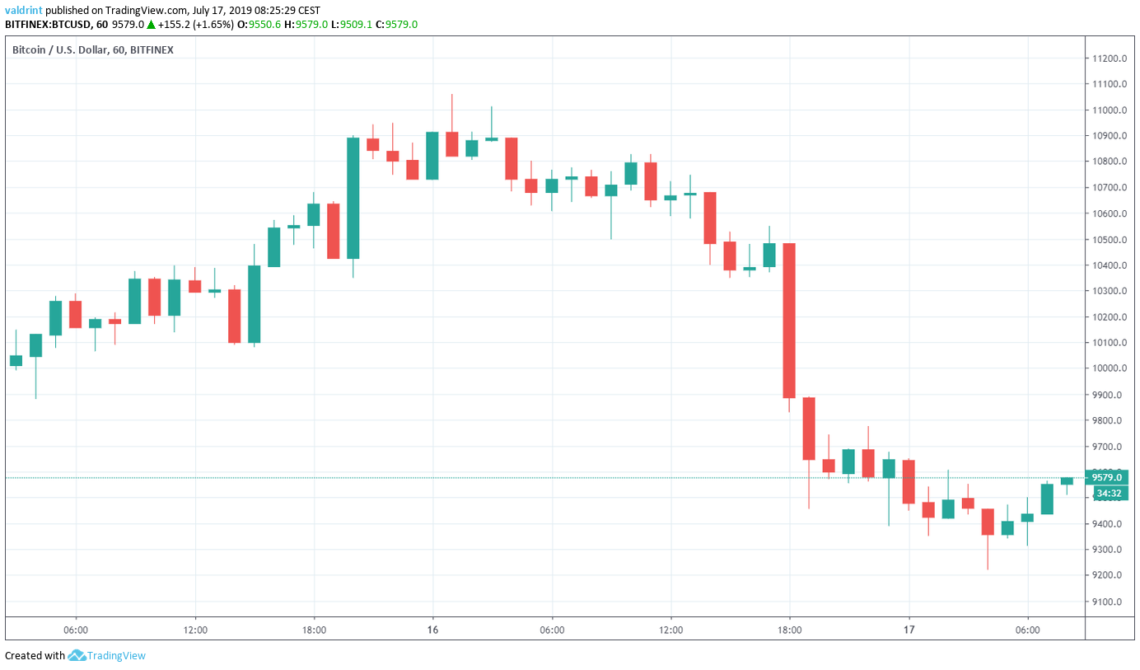
At the time of writing, it was trading at $9500.
Where will it go next? Keep reading below in order to find out.
Bitcoin Price: Trends and Highlights for July 17
- BTC/USD has been decreasing since June 27.
- The 10- and 20-day moving averages have made a bearish cross.
- It is likely in the final wave of an A-B-C correction.
- There is support near $8000, $7000 and $5200.
- BTC is following a short-term descending support line.
Bitcoin Price: Candlestick Analysis
A look at the daily candlesticks shows that yesterday’s decrease cleared a significant support area.
This is likely a sign that sellers have taken control.
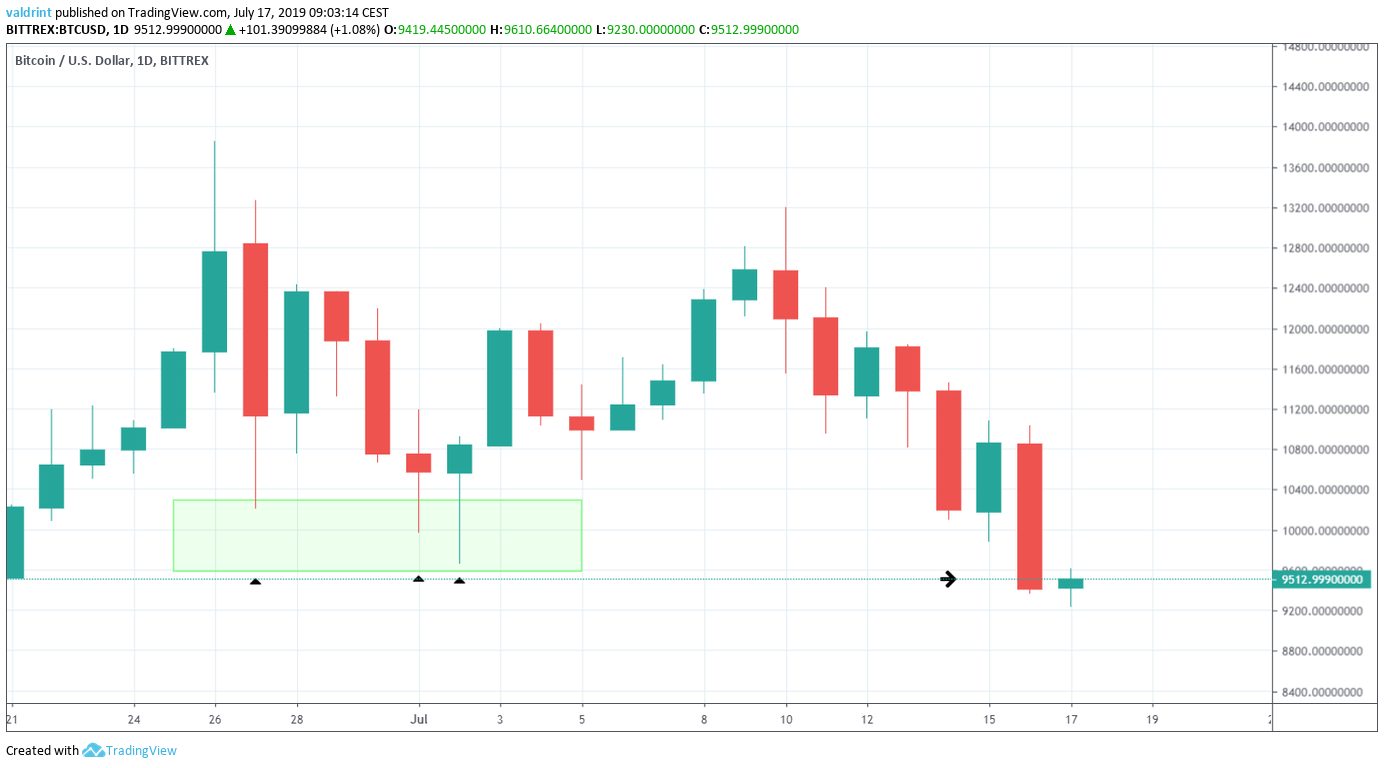
The candlesticks for June 27, July 1 and 2 had long lower wicks, ranging in the area from $9500 to $10,000.
This was a sign of strong buying pressure.
However, yesterday’s candle closed at $9411 — effectively wiping out the buying power.
A look at volume also indicates that the sellers are in control.
Since reaching a high on June 26, the volume has been consistently higher during bearish candles than during bullish ones.
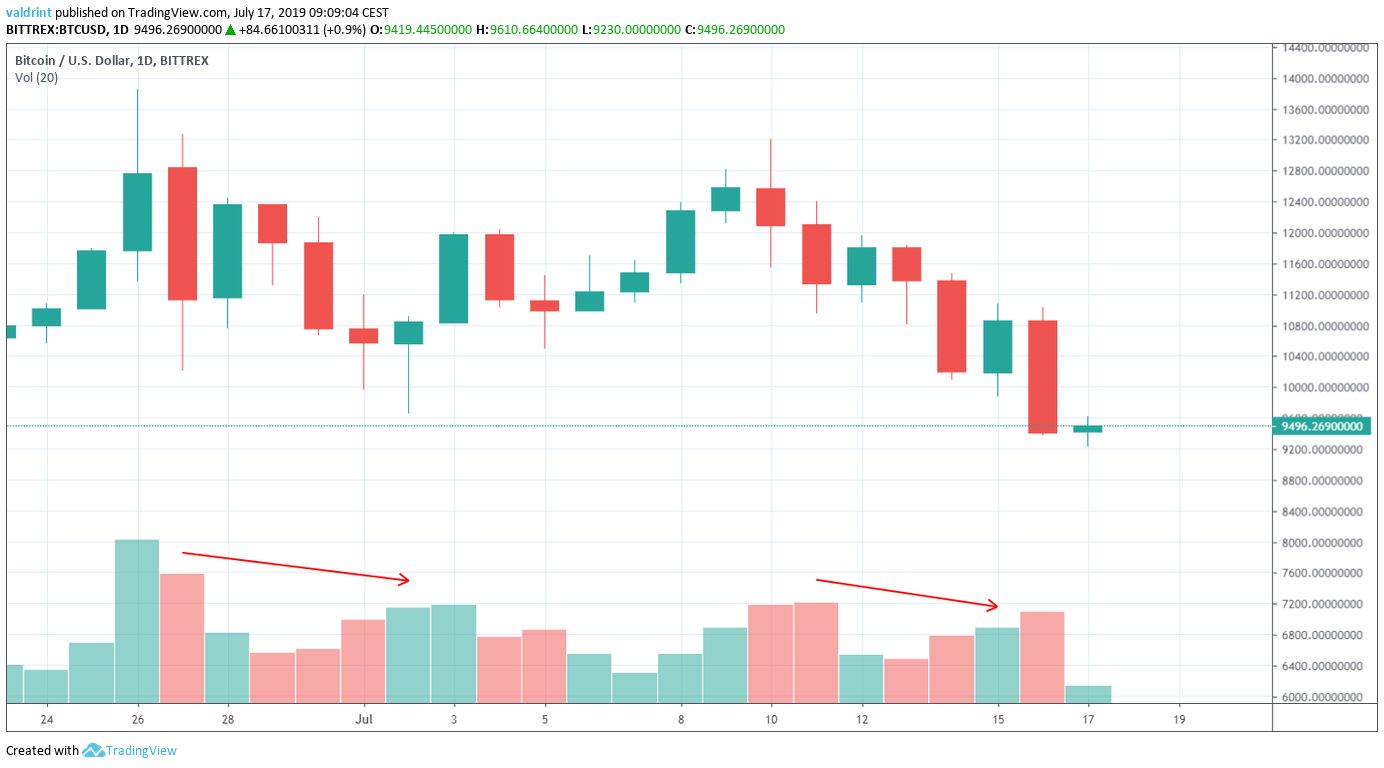
This has been especially visible in the candles for June 27 and July 16.
Finally, a look at the moving averages (MA) confirms that we are in a downtrend.
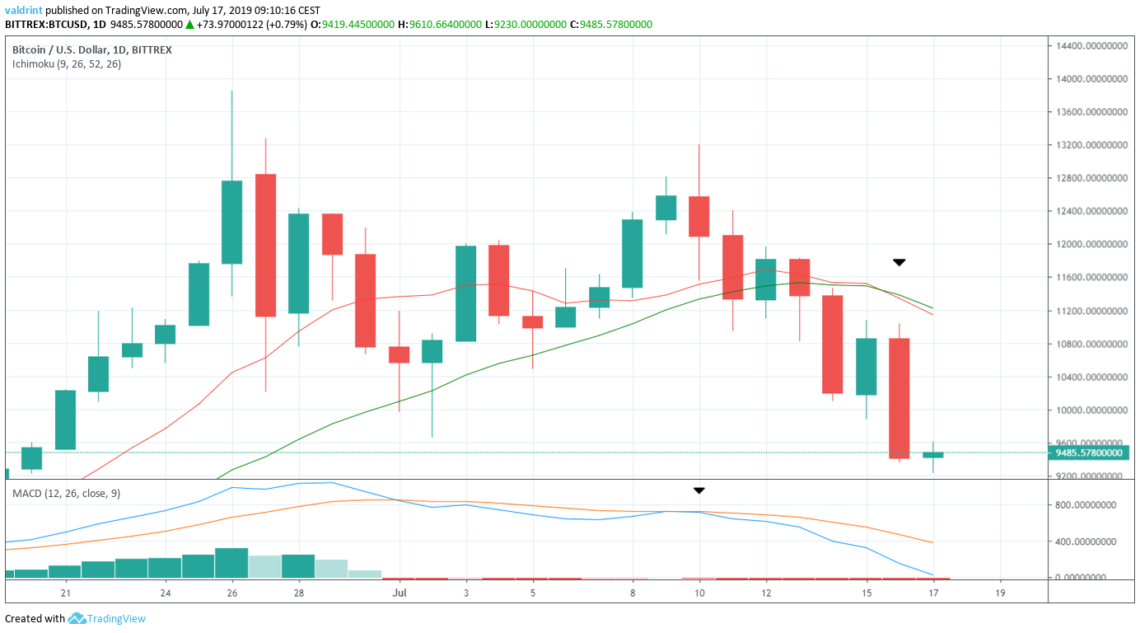
The 10- and 20-period MAs made a bearish cross on July 16.
This was preceded by a bearish cross in the MACD on July 10.
The use of these indicators makes it likely that the price will continue to decrease.
BTC Price Correction
Bitcoin has been decreasing since reaching a high of $13,764 on June 26.
It is likely correcting, following an A-B-C wave count.
We discussed this in detail in our previous correction analysis.
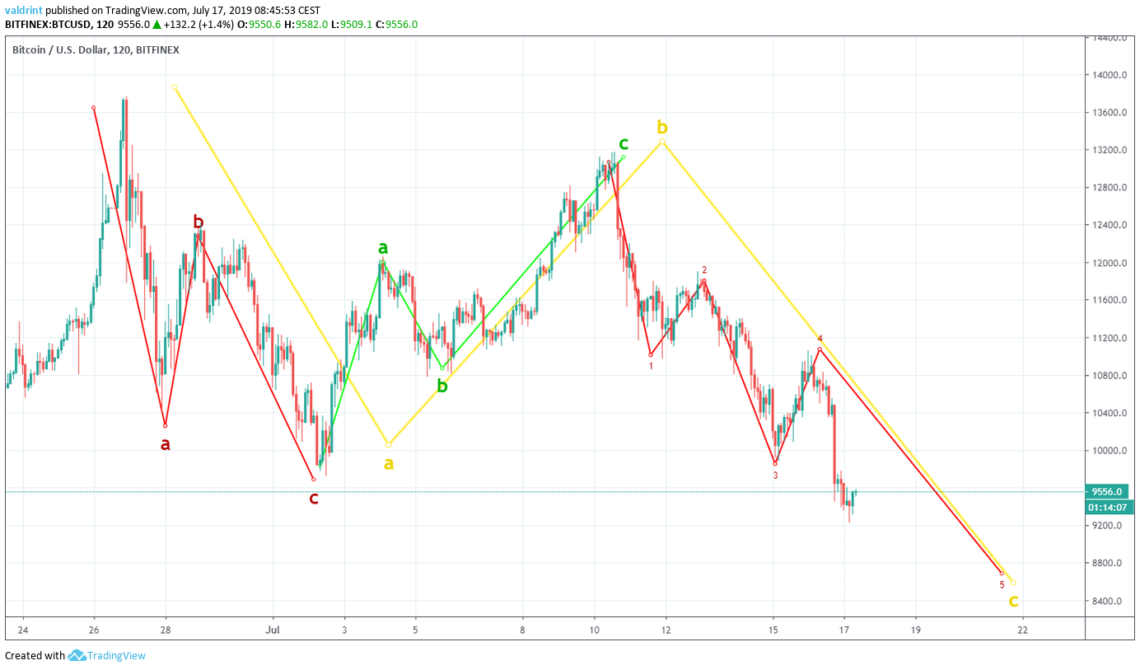
Until now, it has followed a 3-3-5 subwave count.
At the current time, it seems as if it is completing the fifth subwave of the final C wave.
Let’s look at some support areas and see where this wave might end.
Support
Below we have outlined several possible support areas for the completion of this subwave.
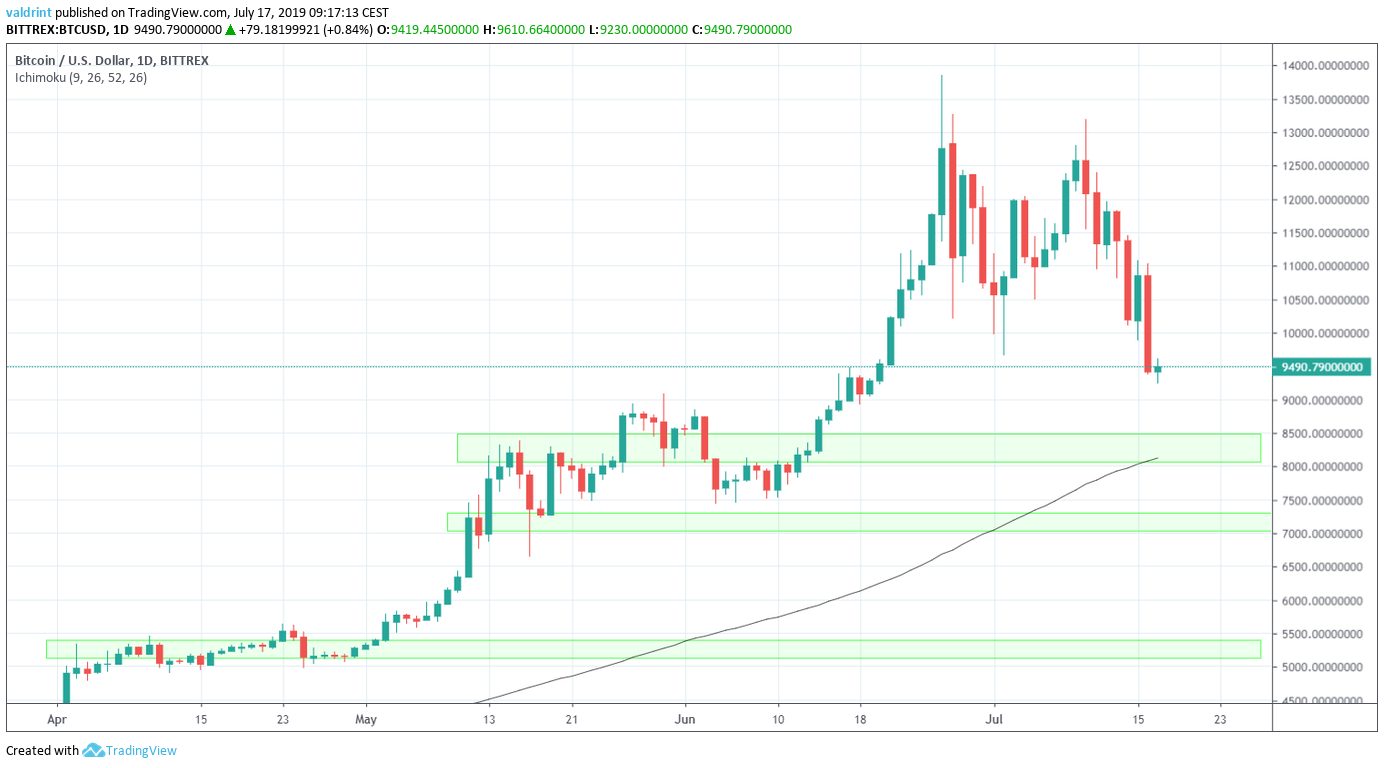
The first and most significant one is found between $8000 and $8400. This area coincides with the 100-day moving average.
The next support areas are found near $7000 and $5200.
Short-Term
In the short-term, the BTC price is following a descending support line.
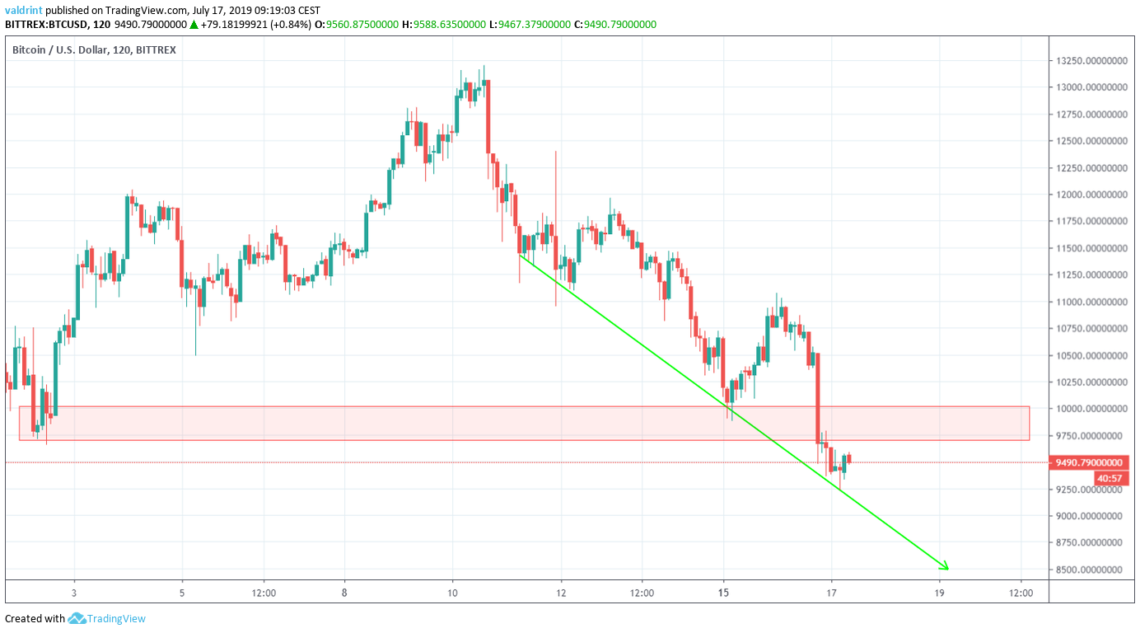
At the time of writing, it was trading right on the support line.
There is some bullish divergence developing in momentum indicators, but only in very short-term time-frames.
Furthermore, there is significant resistance between $9800 and $10,000.
The area previously served as support, and the Bitcoin price recently broke down below that.
Therefore, all possible price increases will most likely be short-lived.
Summary
BTC suffered a rapid decrease on July 16.
It is likely in the final wave of a broader correction that began on June 27.
According to our analysis, it is likely to reach at least one of the support areas outlined above.
