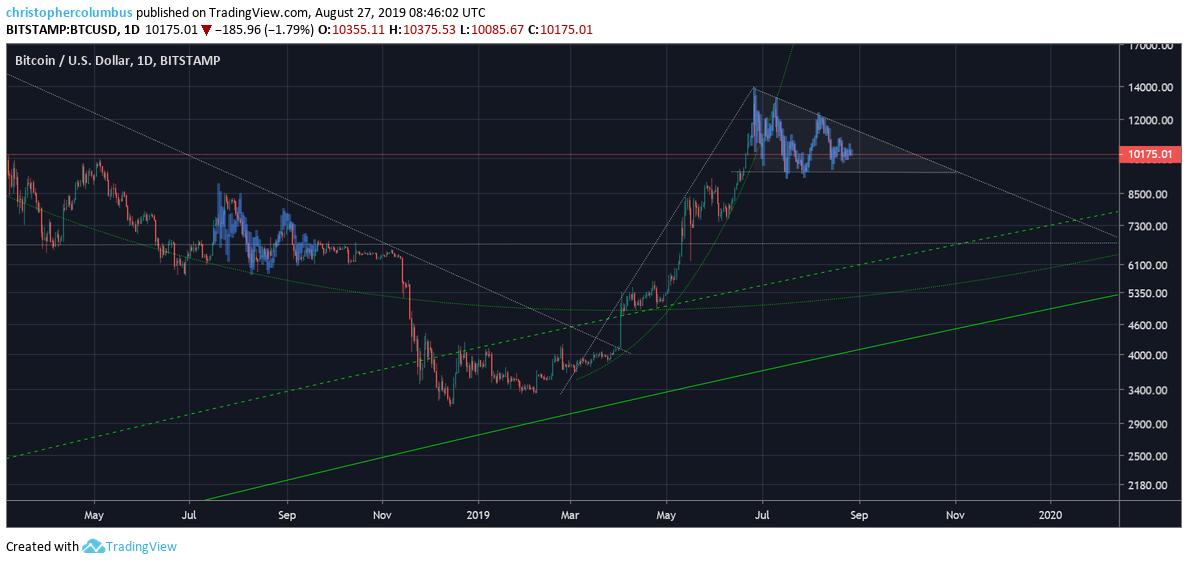
The Bitcoin capitulation in November 2018 was when the cryptocurrency market-leader hit rock-bottom after the bullish explosion of 2017. By some estimates, it seems like we have some repeating indicators for 2019.
Humans naturally tend to look for patterns. When it comes to trading, it could sometimes become a self-fulfilling prophecy if enough people spot the same one. An interesting parallel from 2018 was recently pointed out by trader dave the wave (@davthewave) which many permabulls might wish to unsee.

According to his recent tweet, dave the wave claims that the current wedge forming on the daily chart looks an awful low like the same accumulation period in July to September of 2018. This was the same period which preceded the major capitulation event in December — which saw Bitcoin’s price plunge to near the $3000 level price point.
Now, you’d be silly to take this indicator as a sell signal. Even Dave admits he’s not doing so either. What seems likely, however, is that Bitcoin is mirroring the same period in 2018 — but instead of breaking down as it did then, it could potentially make a major move upward. In the bullish case, this similar pattern to 2018 only seems so because this is a textbook accumulation period within a monthly wedge.
Still, buyers are not taking any chances. There seems to be a cluster of buys around the $8500 price point. Multiple traders have also said that right under the $9000 price point is the ultimate ‘buy zone.’ It remains to be seen whether we get there, however. As of right now, Bitcoin is experiencing a strange period of very low volatility.
By all metrics, it is possible that the leading cryptocurrency will close out the year strong. With the Bitcoin halving coming up in May 2020, investors might soon be kicking themselves while wishing they got in sooner.
