Bitcoin Gets Juiced
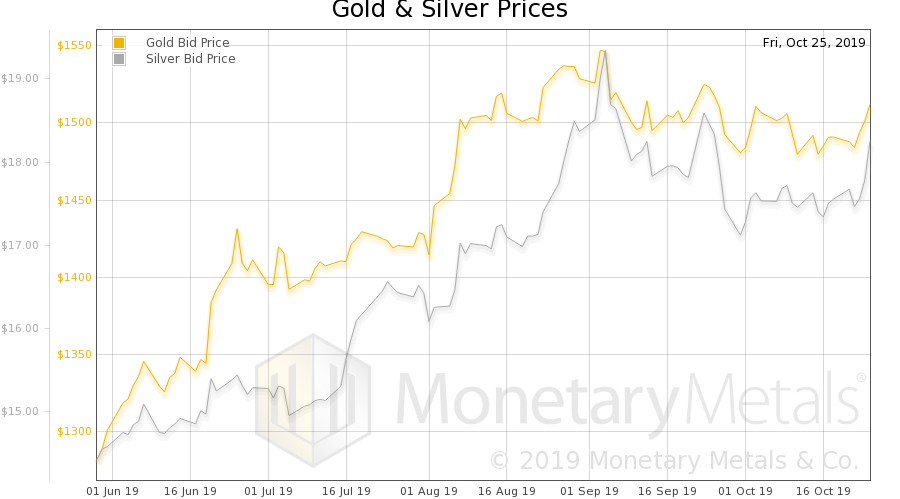
The prices of gold and silver were up $19 and $0.48 respectively last week. But that’s not where the massive in-poring of groceries went.
When Friday began (Arizona time), Bitcoin’s purchasing power was under 75 grocery units (assuming a grocery unit is $100). By evening, speculators added 25 more grocery units to the same unit of bitcoin.
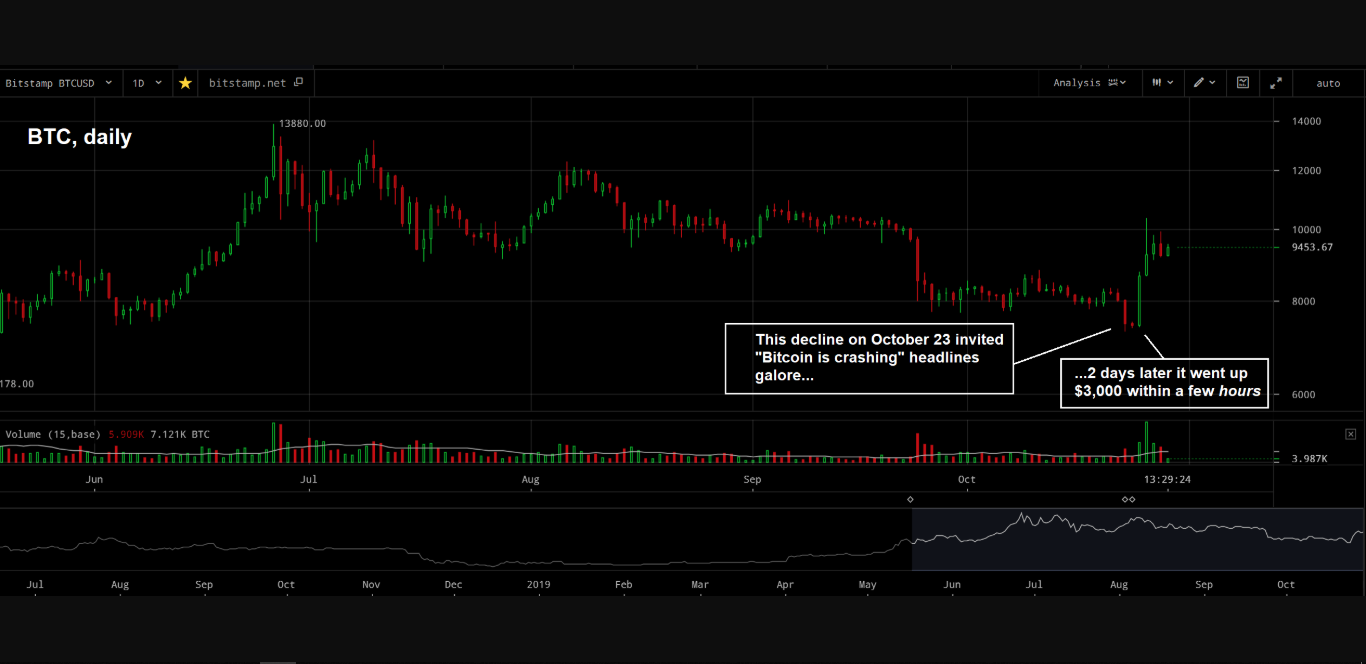
Bitcoin, daily – shortly after breaking below an obvious lateral support level, Bitcoin did an about-face on steroids and rallied $3,000 from low to high in the space of a few hours. Interestingly, this rally was presaged by a number of subtle technical signals – bullish divergences with several of the major “alt coins” emerged on occasion of the seeming break-down on October 23, while concurrently a stealth rally in BSV that had started a day earlier refused to be derailed by the sell-off. These are the types of signals we tend to follow in the cryptocurrency markets – we consider them to be traces left by the biggest traders in these markets. Both breakouts and break-downs of resistance/support levels always have to be closely examined for divergences. Note that technical analysis is the only sensible approach to trading in cryptocurrencies, as it is impossible to gauge their “fundamental” value. The latter depends on all sorts of assumptions, all of which could be wrong. Clearly though, cryptos remain an excellent playground for nimble traders. [PT]
Think of it this way, if you forked over 75 grocery units worth of farmland to buy a Bitcoin Thursday night, the next speculator would fork over 100 grocery units worth of tractors to buy it off you on Friday night. You could buy back your farm land, and consume a quarter of his tractor.
Viewed this way, bitcoin is not the anti-dollar. It is just another chip in the dollar casino, which people can speculate on to increase their purchasing power. And by that, we mean give up their capital in the hopes that someone else will give up even more of theirs. Because, that is what acute yield deprivation makes people do.
Congratulations to anyone who caught this wave. We do not blame the speculators, we blame the Fed for forcing us to play this game.
Fundamental Developments
Read on for a look at that the only true picture of the supply and demand fundamentals of gold and silver. But, first, here is the chart of the prices of gold and silver.
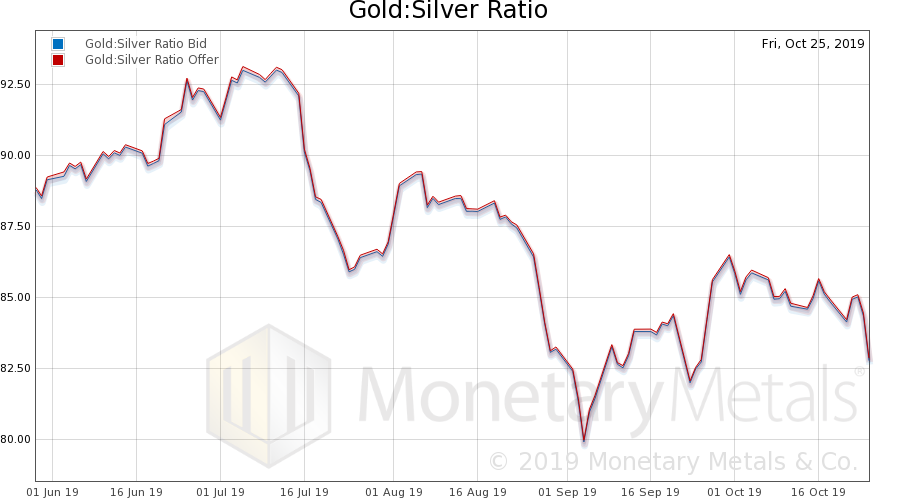
Next, this is a graph of the gold price measured in silver, otherwise known as the gold to silver ratio. The ratio dropped this week.
Here is the gold graph showing gold basis, co-basis and the price of the dollar in terms of gold price.
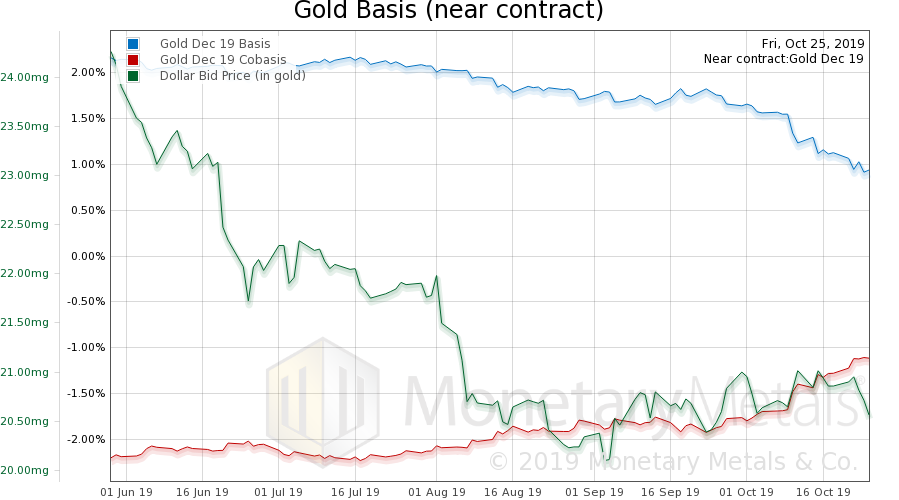
The co-basis increased again, slightly, while the price was up. The Monetary Metals Gold Fundamental Price, was up another $28 this week, to $1,511.
Now let’s look at silver.
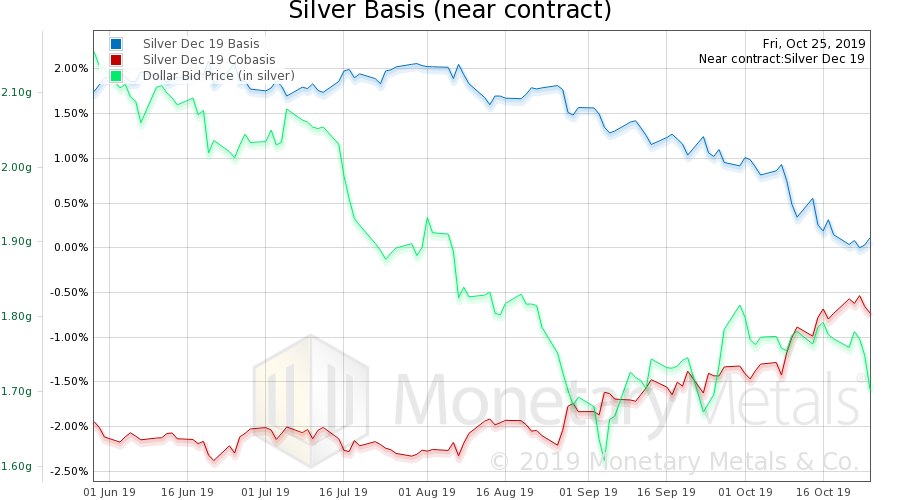
In silver, the December co-basis rose slightly, though not the silver basis continuous.
Despite the rise in market price, the Monetary Metals Silver Fundamental Price fell another 8 cents to $16.87.
