Here is an update on Bitcoin's price development as well as the long and short term perspective:
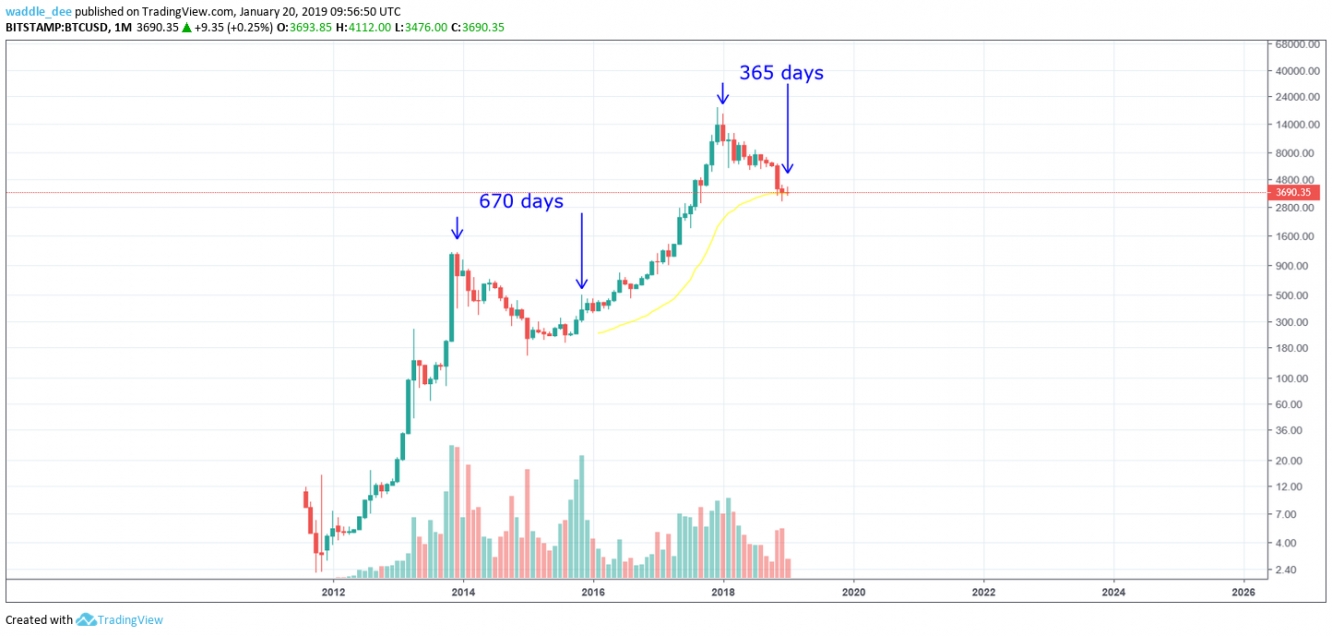
On this monthly BTC/USD chart, you can see the entire price data of Bitcoin. Bitcoin's price action seems to mimic the bear market that lasted from 2014 to late 2015. As indicated by the blue arrow, I consider November of 2015 as the end of the bear market since this candle finally broke the resistance of $300 and closed well above that. As of now, I can see no reason as to why things shouldn't pan out the same way as they did in 2014-2015. Therefore the long term projection is a prolonged bear market that will last throughout the coming months and might even last for the entirety of 2019 if history is to repeat itself.
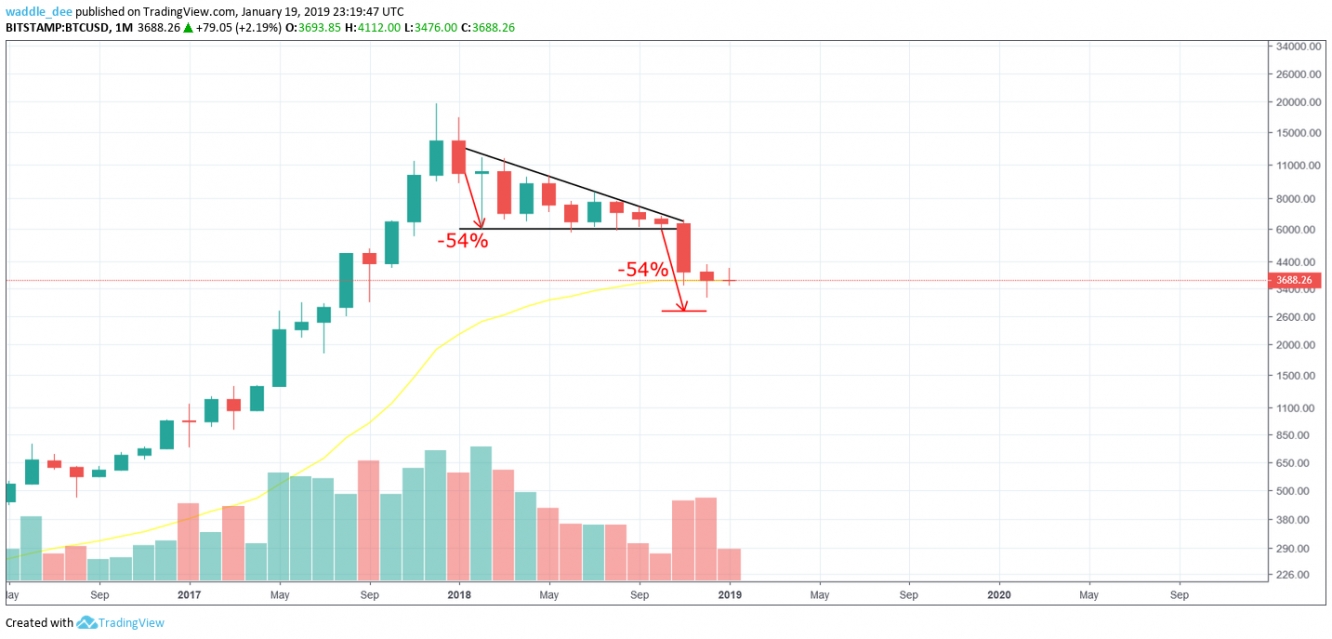
2018's price action formed one big descending triangle, with a price target located at around $0, when talking in absolute numbers (the opening range of the triangle reaches from roughly $12,000 to $6,000). It's unlikely that BTC will go that low so let's use the percental price target, which lies at $2750 in the event of a 54% drop. That marks our next PT in case of another downwards movement. However, as can be seen on the chart, some kind of bullish hammer has formed last month. It's not perfect, but it shows strong rejection to the downside. Furthermore, the yellow 55-EMA has also been holding strong. Could this indicate a change in the trend? After all, we had 5 consecutive red months which historically has never happened before. A major bounce upwards may be waiting in the wings. Let's take a closer look:
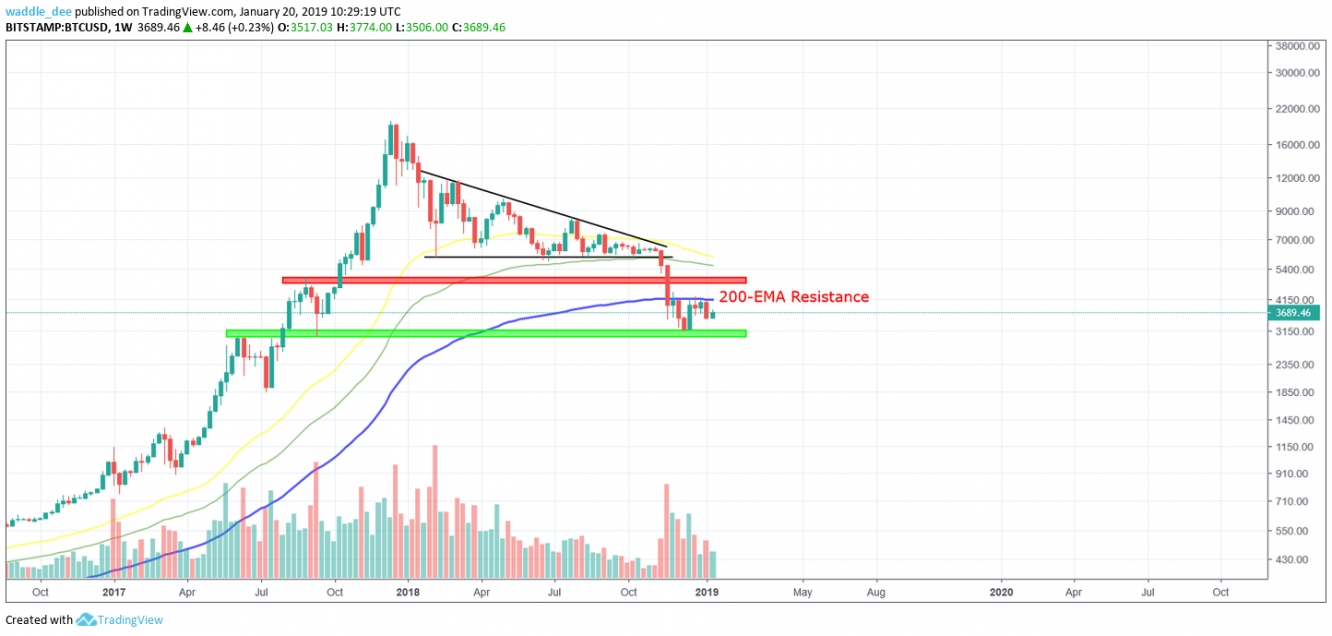
$3,000 has been the first major support after the breakdown of the descending triangle. The conservative target in case of a bounce lies at $4,200. That's where the price has been rejected by the blue 200-EMA multiple times. A breakout and close above the weekly 200-EMA will indicate very bullish momentum and might initiate a big wave upwards. The next clear resistance is located at $4,750-$4,90.
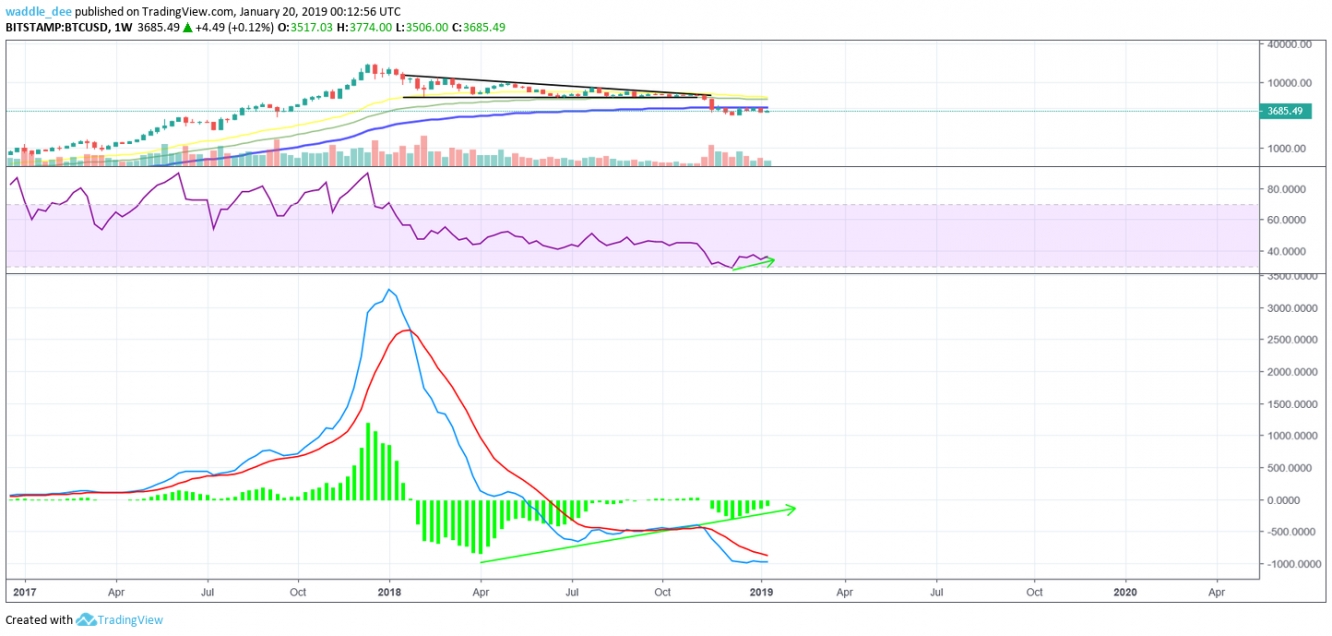
MACD and RSI on the weekly time frame are looking quite well for the bulls: The RSI has touched the 30-mark and is ready to gain strength while there is a giant bullish divergence on the histogram of the MACD.
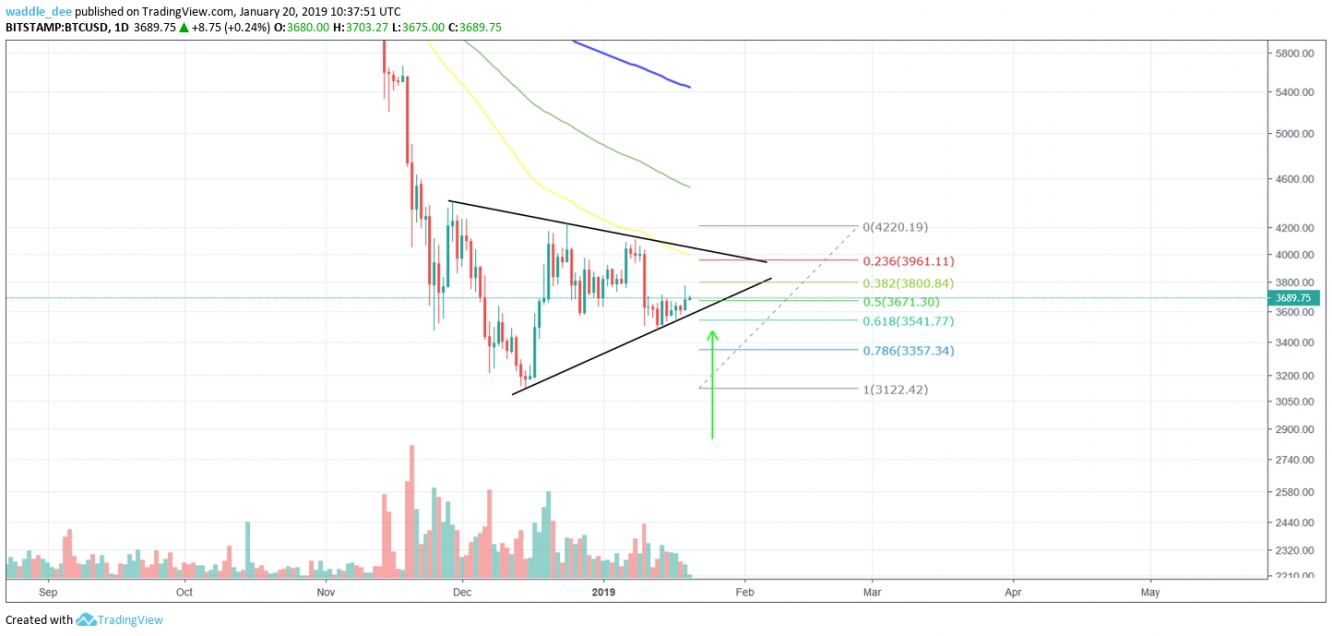
Right now Bitcoin is forming a symmetrical triangle while trading at the golden ratio Fibonacci Level of BTC's most recent bounce. The level has been holding reliably so far, however, EMAs are catching up to act as resistance. The triangle support trendline and the 0.618 Fib level may serve as a viable entry point when looking to open a long position.
Let's conclude: Price Action and 55-EMA on the monthly are looking bullish. Indicators on the weekly are looking even better, but the weekly 200-EMA has proven to be extremely tough to break through.
Everything is set for a major bounce when speaking in terms of short and mid-term outlook. Bears might be running out of steam as they relentlessly and incessantly pushed the price down during the previous 5 months.
However, in the long term, there are no strong signs of a trend reversal as of yet. The prevailing trend remains bearish.

