Demand has pushed Bitcoin prices above the critical $10,000 level. If these price levels turn into support, then BTC could be on its way to $12,500.
Key Takeaways
- Bitcoin experienced a bullish impulse that pushed its price above the $10,000 barrier.
- Multiple bearish indicators show that turning the $10,000 price level into support won't be easy.
- A further increase in demand may see BTC climb towards $12,500 while a spike in sell orders could be catastrophic.
Bitcoin has jumped above the critical $10,000 price level. If this level turns into support, then BTC could be on its way to $12,500.
Bitcoin Is Breaking Out
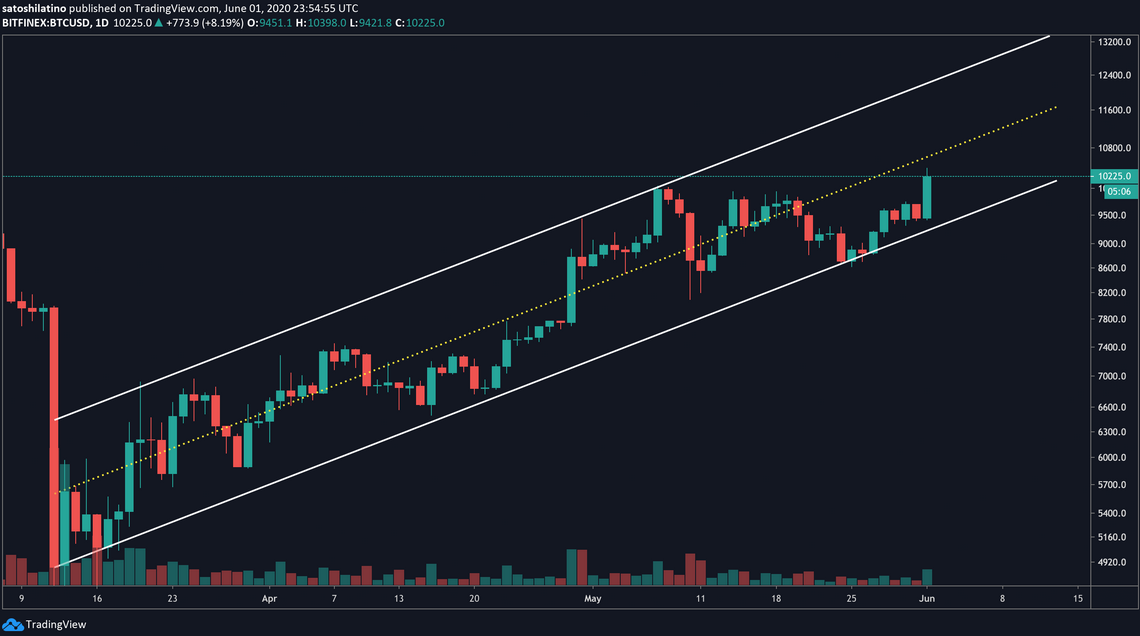
Bitcoin is back in the green as it breaks through the infamous $10,000 resistance level. If price history repeats itself, then the flagship cryptocurrency could be poised for an upswing towards $12,500.
Since March’s Black Thursday, Bitcoin’s price action has been contained within an ascending parallel channel. Each time BTC surges to the upper boundary of this channel, it pulls back to hit the lower boundary, and from this point, it bounces back up again.
After the most recent rebound from the bottom of the channel, it seems like the bulls have stepped in. Now, one could expect a further advance to the middle or upper boundary of the channel.

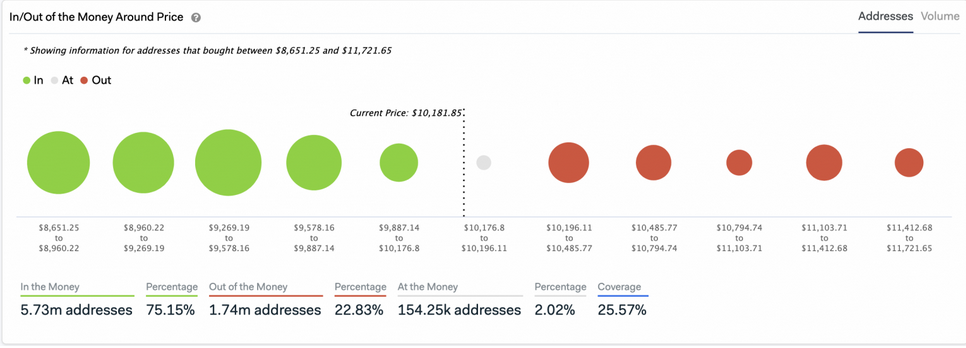
IntoTheBlock’s “In/Out of the Money Around Price” (IOMAP) model suggests that a full-blown rally to the top of the channel is most likely to happen. Based on this on-chain metric, there are not any significant barriers above the current price levels that would prevent a bullish impulse.
On the flip side, the IOMAP cohorts reveal that there are enough supply walls to absorb any downward pressure. Especially the one between $9,270 and $9,580, where roughly 1.6 million addresses hold over 1.2 million BTC purchased at these prices.

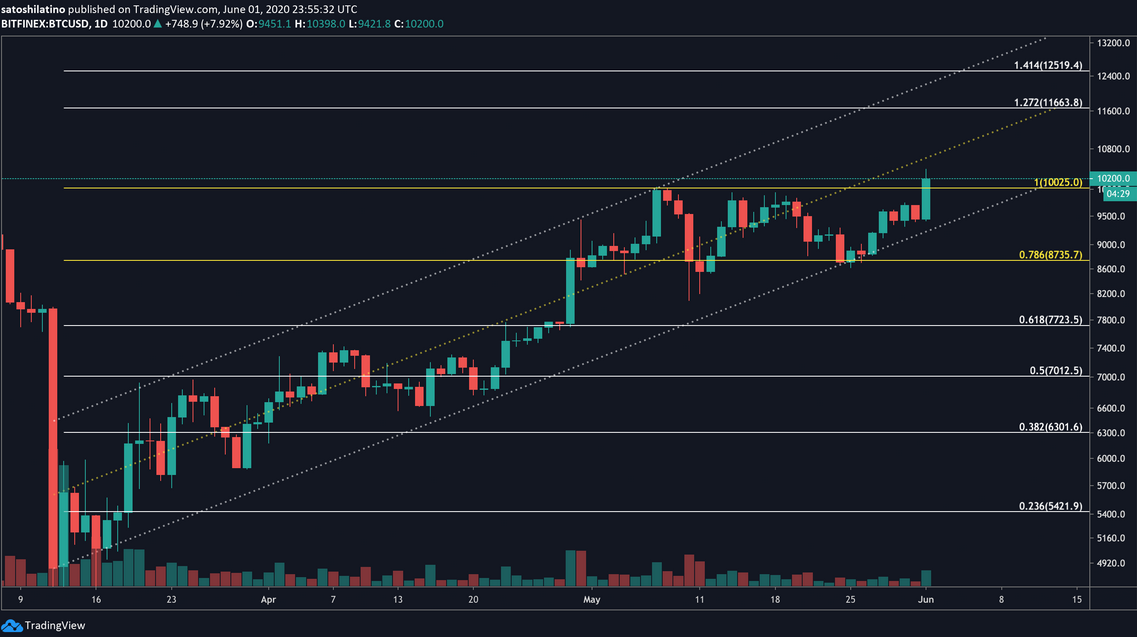
Nevertheless, the Fibonacci retracement indicator reveals that in the event of a further price increase, the next barrier to watch out is the 127.2% Fib level. This area of resistance sits at $11,700. Breaking through the barrier will increase the odds for a move to the 141.1% Fib level, which is around $12,500.

It is worth noting that for the bullish outlook to materialize, the bellwether cryptocurrency must hold above the $10,000 support level. Otherwise, BTC may fall to its next support wall around $9,600.
Bearish Signs on the Horizon
The recent price action sent investors into “greed,” according to the Crypto Fear and Greed Index. This fundamental indicator analyzes the sentiment of the market by combining price and social media data and crunching it into a single number.
The Fear and Greed Index moved to 56 (greed) for the first time since the beginning of May when Bitcoin was trading around the same price levels. But greed is not necessarily a good sign. “Be fearful when others are greedy and greedy when others are fearful.”
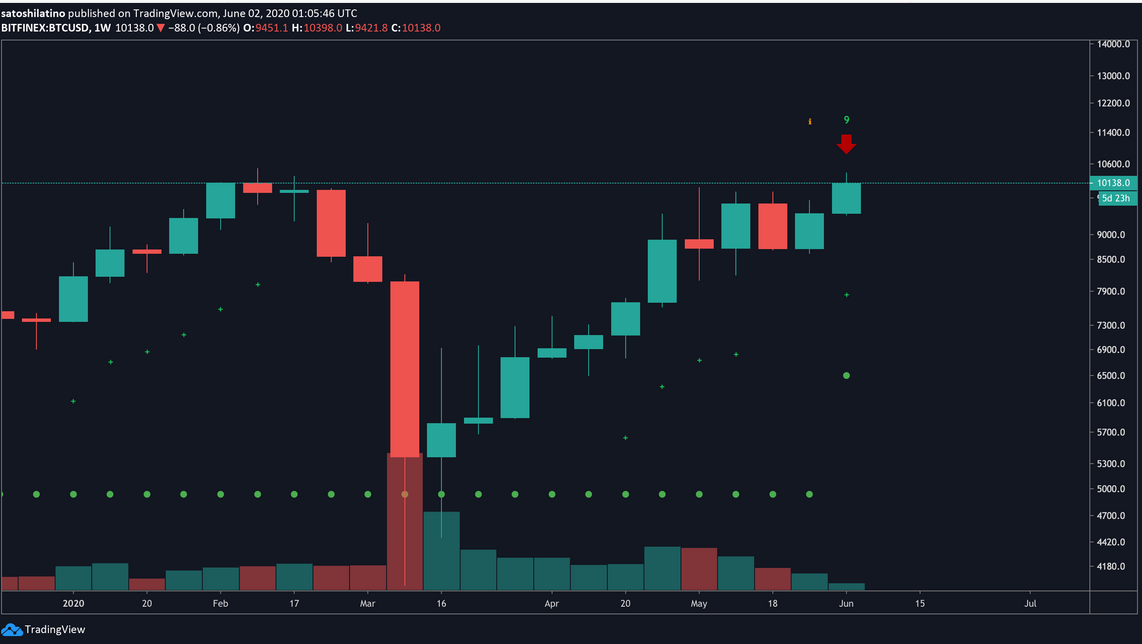
Coincidentally, the TD sequential indicator is presenting a sell signal in the form of a green nine candlestick on BTC’s 1-week chart. The bearish formation estimates a one to four weekly candlesticks correction before the uptrend resumes.

Even though Bitcoin may still have more gas in the tank, the outlook forecasted by TD setup must be taken seriously. The current run-up may encourage crypto enthusiasts to FOMO-in. Meanwhile, whales appear to be dumping their holdings on the market while prices are hot. As Santiment data shows, the number of addresses holding 100 to 1,000 BTC declined over 5% as Bitcoin moved above $10,000.
The disproportionate impact on prices that these large investors have because of their enormous holdings and their ability to coordinate buying and selling activity is a clear sign that one must remain cautious. Now that the market seems at the cusp on its next bull cycle, having cash ready to deploy is a must.
