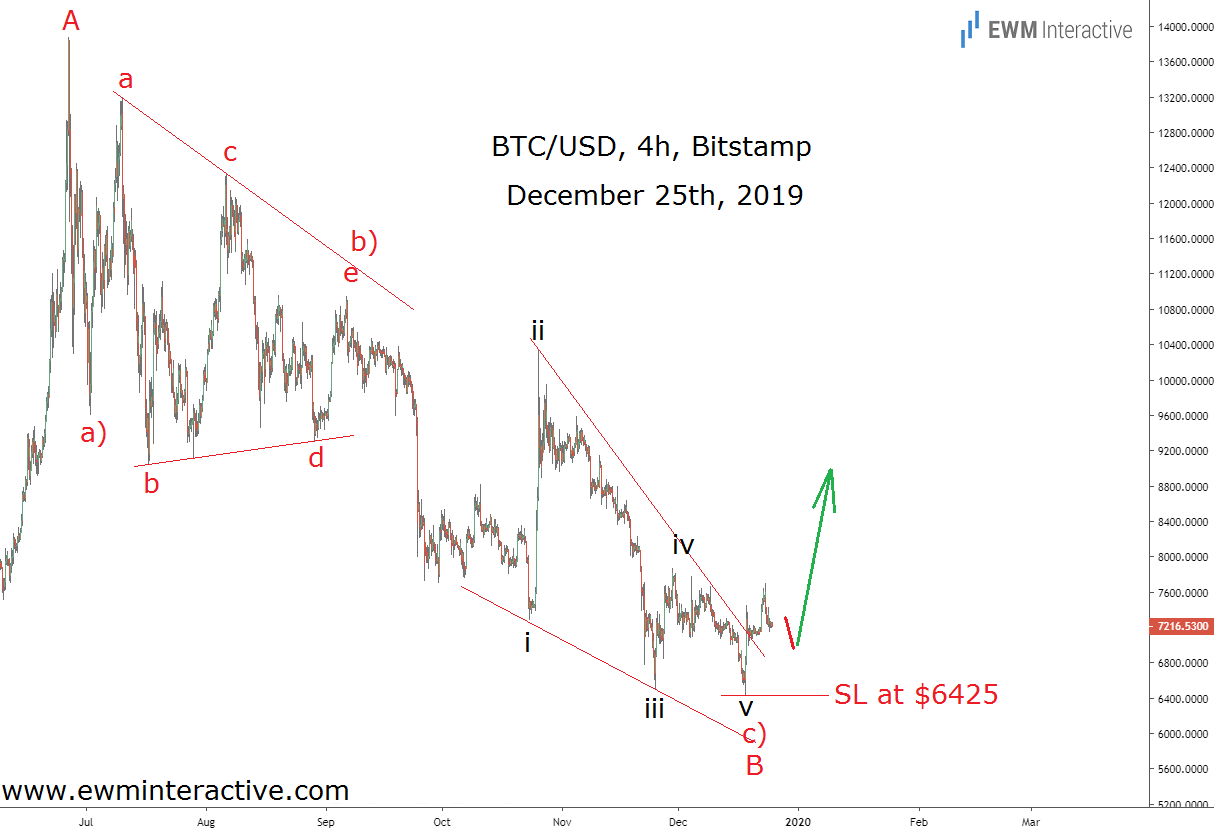
The price of Bitcoin was hovering around $7200 on Christmas, down from $13 880 six months earlier. And while the majority of headlines were all doom and gloom, the cryptocurrency‘s price charts were telling a very different story.
Bitcoin was down 48% from its recent top, but that wasn’t the time to join the bears. The analysis below, sent to subscribers on Dec. 25, revealed that the few bulls’ optimism was actually warranted this time.

Bitcoin’s 4-hour chart showed that the decline between $13 880 and $6425 was a simple a)-b)-c) zigzag. The correction included a triangle in wave b) and an ending diagonal in wave c). BTCUSD was in an uptrend prior to this decline, so it made sense to expect that uptrend to resume once the pullback was over.

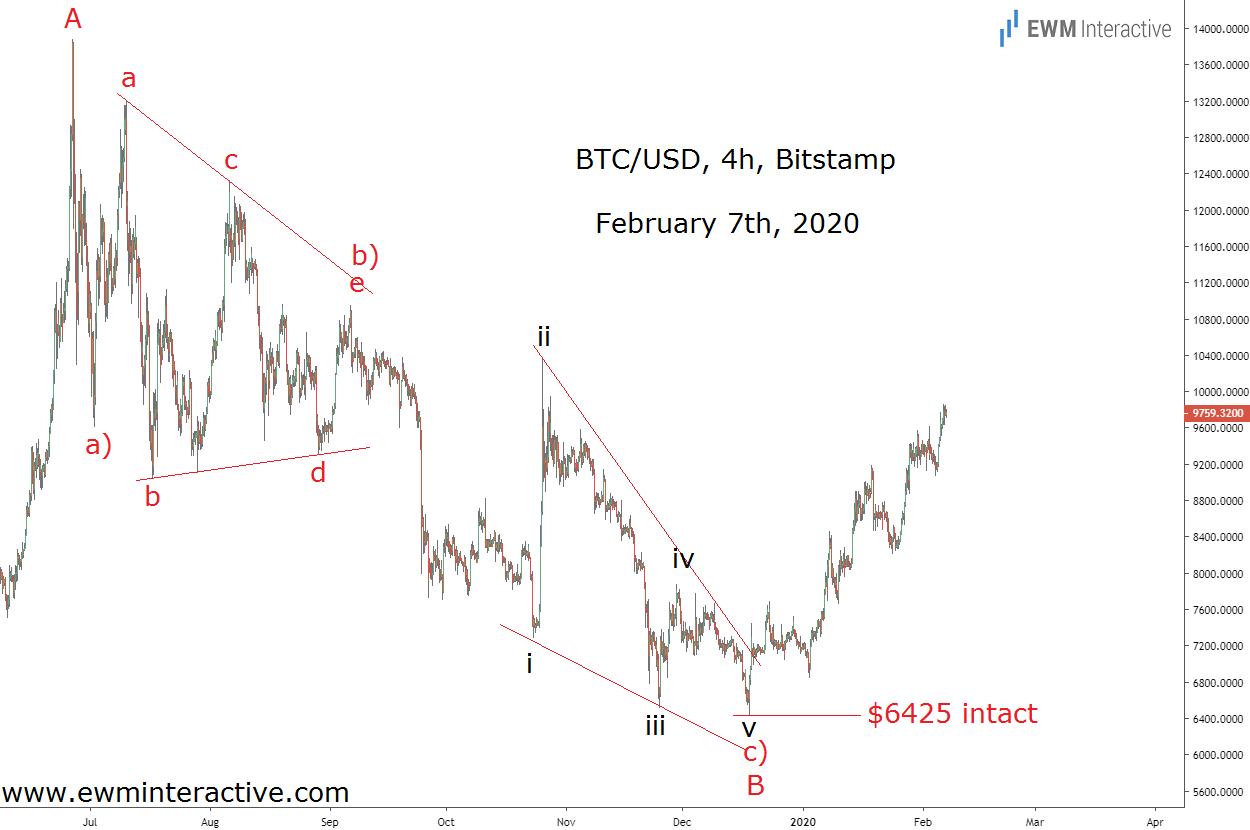
In addition, the Elliott Wave analysis allowed us to identify $6425 as the invalidation level for this count. A stop-loss order there would limit the risk of loss while keeping the profit potential open. A month and a half later now, the updated chart below shows how the situation developed.
Bitcoin is currently trading near $9770, up 35% since Christmas. More importantly, $6425 was never threatened. And while the price is going to stay volatile and react to every single piece of news, traders should remember to look at the charts, too. Quite often, the information they hold can put you months ahead of the next major move.
