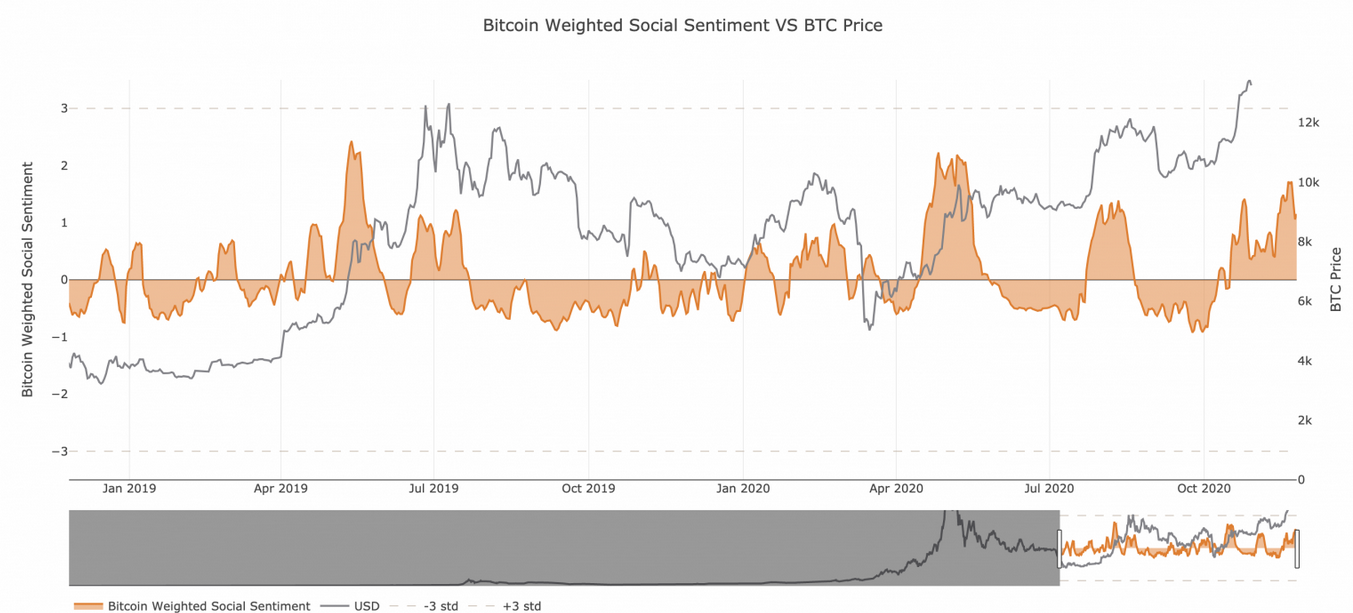
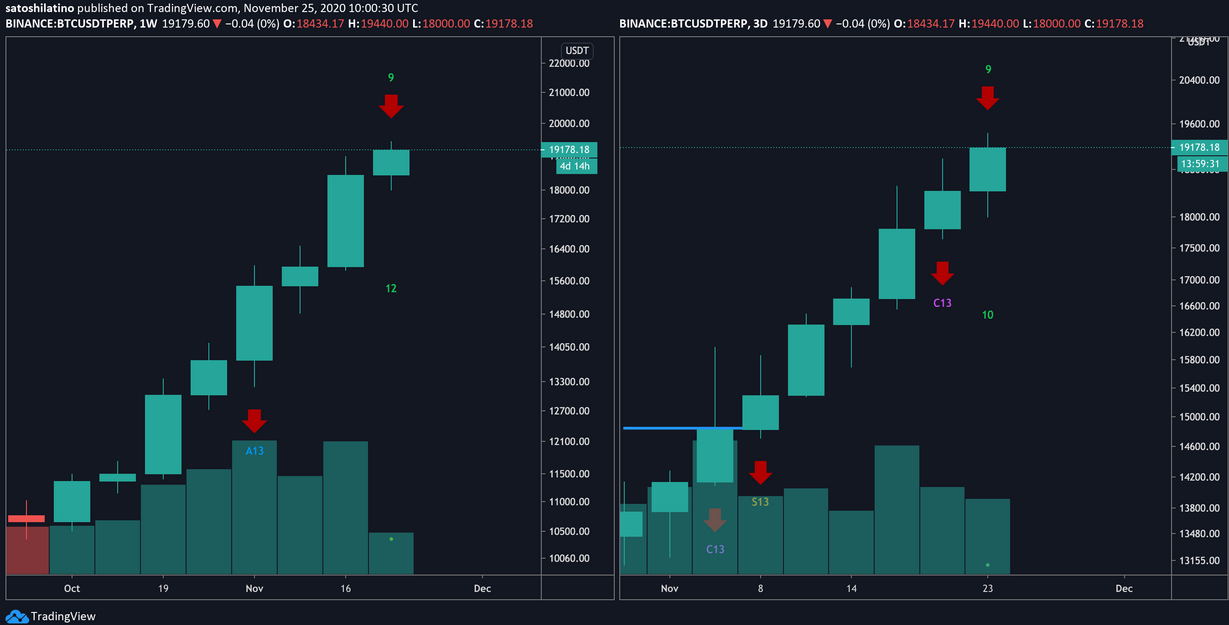
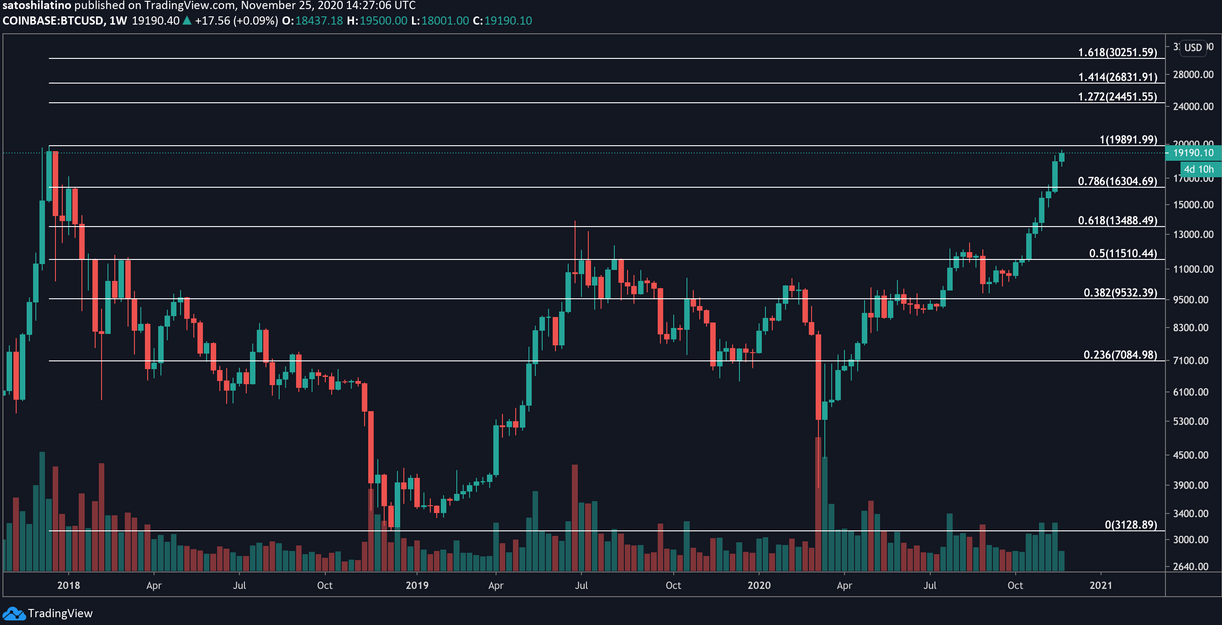
Bitcoin approaches overbought territory despite bullish sentiment in the cryptocurrency market. Bitcoin had been sitting a few hundred dollars shy from new all-time highs, but several on-chain metrics and technical indexes suggest that the latest correction may steepen. Bitcoin made headlines after climbing above $19,000 for the first time since December 2017. The chatter around the flagship cryptocurrency skyrocketed as prices surged over 80% in the past two months. Data from Santiment reveals that the number of BTC-related mentions across social media networks surpassed 1.3 billion. Meanwhile, Bitcoin’s weighted social sentiment peaked at the highest positivity level since June. “The crowd is still quite positive currently, and we consider this to be confidently bearish territory based on history,” said Brian Quinlivan, Marketing and Social Media Director at Santiment. The positive social engagement metrics coincide with the extreme levels of optimism recorded among market participants. Historically, Bitcoin’s price tumbles when social perception is high. The question now is defining the depth and duration of an incoming correction. Some, like Quantum Economics analyst Jason Deane, told Crypto Briefing that: “Some technical indicators do show that Bitcoin is currently overbought and I think it is entirely possible that there will be a minor correction quite quickly after the ATH is breached. However, because Bitcoin’s fundamentals are strong, its supply is fixed and institutional interest shows no sign of slowing down, my view is that I’d expect any correction to be shallow and short-lived before resuming upwards price discovery.” The TD sequential indicator adds credence to the pessimistic outlook. This technical index presented sell signals in the form of green nine candlesticks on BTC’s 1-week and 3-day charts. The bearish formations forecast a one to four weekly candlesticks retracement before the uptrend resumes. A spike in sell orders around the current price levels may be significant enough to validate the TD setup’s outlook. If this were to happen, one of the most significant support levels underneath Bitcoin sits at $11,500. But before prices can fall to this point, there are two other demand areas that this cryptocurrency must break. These support levels lie at $16,000 and $13,500, respectively. It is worth mentioning that if the bellwether cryptocurrency manages to close above December 2017’s high of $19,900, the bearish outlook will be jeopardized. Trading veteran Peter Brandt believes that moving past this resistance barrier could even see BTC rise towards $56,000. The 127% and 161.8% Fibonacci retracement levels may serve as potential hurdles on the way up. These areas of interest sit at $24,500 and $30,200, respectively. Key Takeaways
Crypto Enthusiasts Grow “Extremely Greedy”

Bitcoin Prepares for Retracement


- English (UK)
- English (India)
- English (Canada)
- English (Australia)
- English (South Africa)
- English (Philippines)
- English (Nigeria)
- Deutsch
- Español (España)
- Español (México)
- Français
- Italiano
- Nederlands
- Polski
- Português (Portugal)
- Português (Brasil)
- Русский
- Türkçe
- العربية
- Ελληνικά
- Svenska
- Suomi
- עברית
- 日本語
- 한국어
- 简体中文
- 繁體中文
- Bahasa Indonesia
- Bahasa Melayu
- ไทย
- Tiếng Việt
- हिंदी
Bitcoin Headlines Sour As Leading Cryptocurrency Corrects
Published 11/26/2020, 12:20 AM
Bitcoin Headlines Sour As Leading Cryptocurrency Corrects
Latest comments
Loading next article…
Install Our App
Risk Disclosure: Trading in financial instruments and/or cryptocurrencies involves high risks including the risk of losing some, or all, of your investment amount, and may not be suitable for all investors. Prices of cryptocurrencies are extremely volatile and may be affected by external factors such as financial, regulatory or political events. Trading on margin increases the financial risks.
Before deciding to trade in financial instrument or cryptocurrencies you should be fully informed of the risks and costs associated with trading the financial markets, carefully consider your investment objectives, level of experience, and risk appetite, and seek professional advice where needed.
Fusion Media would like to remind you that the data contained in this website is not necessarily real-time nor accurate. The data and prices on the website are not necessarily provided by any market or exchange, but may be provided by market makers, and so prices may not be accurate and may differ from the actual price at any given market, meaning prices are indicative and not appropriate for trading purposes. Fusion Media and any provider of the data contained in this website will not accept liability for any loss or damage as a result of your trading, or your reliance on the information contained within this website.
It is prohibited to use, store, reproduce, display, modify, transmit or distribute the data contained in this website without the explicit prior written permission of Fusion Media and/or the data provider. All intellectual property rights are reserved by the providers and/or the exchange providing the data contained in this website.
Fusion Media may be compensated by the advertisers that appear on the website, based on your interaction with the advertisements or advertisers.
© 2007-2025 - Fusion Media Limited. All Rights Reserved.
