Because of President Trump’s pressure on the Federal Reserve, the central bank could end up cutting interest rates. According to Pompliano, such a lax monetary policy could see capital flow to Bitcoin. In turn that will lift prices toward $100,000 by 2021.
There is a direct correlation between Bitcoin price expansion and global economic turmoil. A slip in the latter causes a sporadic rise in the other, and there is evidence.
Bitcoin (BTC) surprised markets and and the media alike on July 3, jumping over 20% in 24 hours to overcome resistance at $11,000.
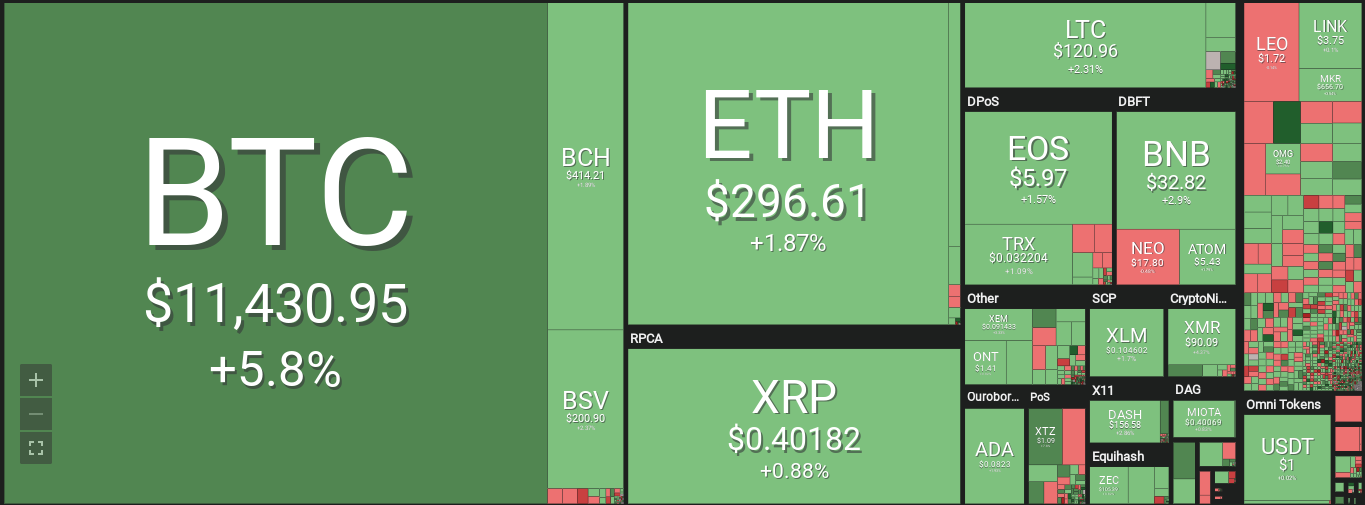
Image Source : Coin360
Data from Coin360 put BTC/USD firmly in the green Wednesday, following a turbulent few days which saw the pair drop as low as $9,688.
The sudden reversal immediately rubbished the theories emerging in the mainstream press and from cryptocurrency naysayers. Even if June 27 candlestick is visible, June 26 bull bar leads this trade plan. Any form of price volatility forcing BTC prices above $14,000 and June 26 high must be with high trade volumes exceeding 82k. Similarly, a counter candlestick wiping out gains of July 3 as BTC crumble below $9,500 must ideally be with high participation.
Longer term, curiosity remains about the impact of institutional trading pushing up the bitcoin price. This week has seen two announcements - from both trading platform ErisX and exchange Binance - confirming they will offer bitcoin futures.
What happened in the Altcoin Market:
Altcoin markets saw some much-needed gains as bitcoin rose, with many assets in the top twenty cryptocurrencies by market cap rising around 7%.
Ethereum, the largest altcoin, rose 7.6% to challenge resistance at $300 once again, having hit a low of $272.
ETH/USD sits below the short-term upside trendline (currently at $287). A sustainable move above this level will mitigate the immediate bearish pressure and allow for another attempt at $300. A confluence of strong technical indicators located in approach to this level includes SMA50 (Simple Moving Average)and SMA100 on 4-hour chart, SMA200 and the upper line of the Bollinger Band on 1-hour chart.
At the time of writing, ETH/USD is changing hands at $285, moving within the short-term downside trend.

