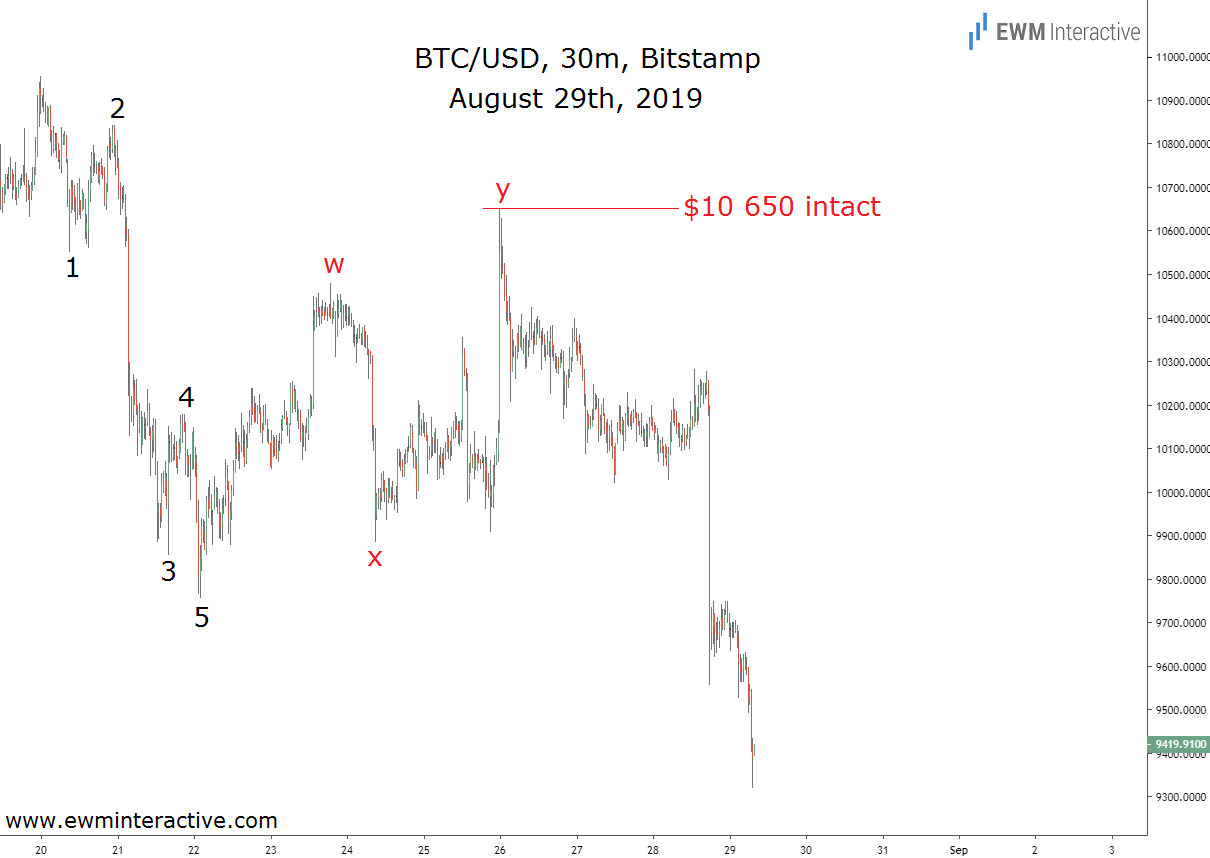
The price of Bitcoin plunged sharply on Wednesday and keeps falling early Thursday. BTC/USD reached an intraday high of $10 280, before crashing to as low as $9555 yesterday. Today, the bears are still in charge and managed to drag the price to $9320 so far. To sum it up, Bitcoin lost almost $1000 per coin in less than 24 hours. But why?
One explanation can be that a large amount of Bitcoin futures is set to expire this Friday. Another reason for the selloff touted by crypto experts is the low level of liquidity in the market, which makes it much easier for the so-called “whales” to move the needle.
Bitcoin Price Chart Offers a Third Explanation
We admit that both explanations make sense. The problem is they make sense only in hindsight. In order to profit from major market moves, traders need a method of analysis that puts them ahead of these moves. Unless they can turn back time, knowing why something happened after the fact is of little use to traders.

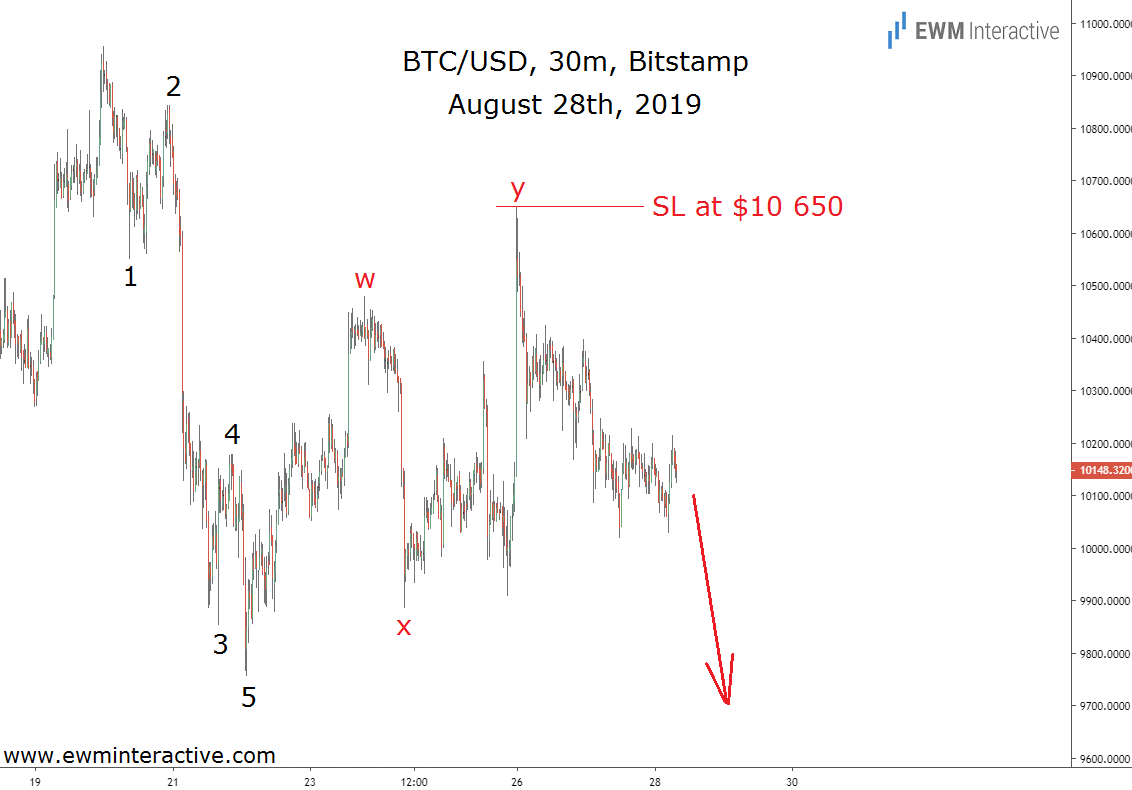
Elliott Wave analysis is our preferred way of dealing with that problem. Yesterday, for example, while BTC/USD was still near $10 150, there was a textbook Elliott Wave setup on the chart below. It was sent to our subscribers as part of our regular Wednesday updates.
The chart revealed that the decline from $10 955 to $9755 was impulsive. It was labeled 1-2-3-4-5 and was followed by a w-x-y double zigzag correction to the upside. Taken together, the impulse and the correction formed a complete 5-3 wave cycle pointing south.
Hence, more weakness had to be expected as long as the price stayed below the end of wave “y” at $10 650. There was no way to know how soon the bears were going to finish the job nor how the media was going to explain their actions. All we knew was that the above-shown setup tilted the odds immensely in bearish favor. Then this happened:

$10 650 was never put to a test. Bitcoin started falling almost immediately and still hasn’t been able to find a reliable support as of this writing. And while following the news can make you better informed, it will hardly make you a better trader. Elliott Wave analysis, on the other hand, might help with that.
