What will BTC/USD bring next week?
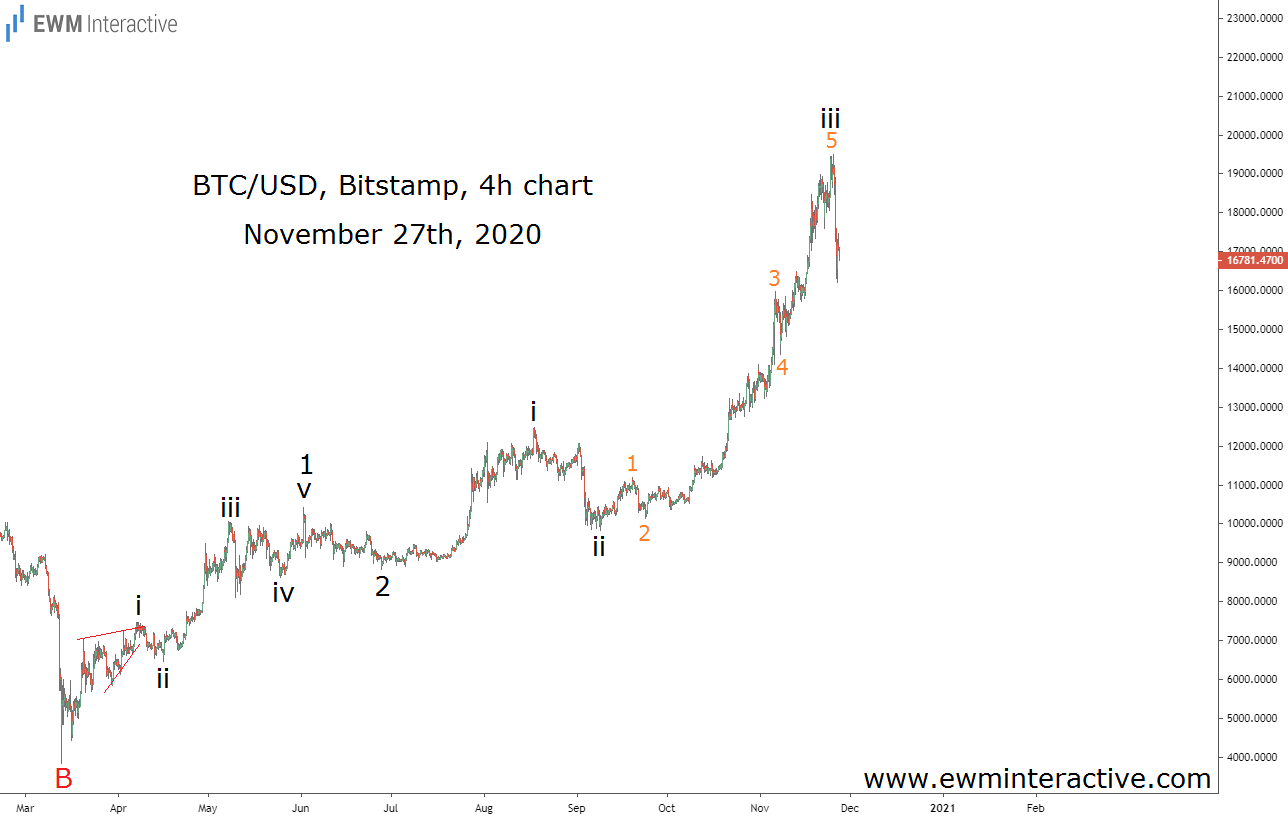
Thursday was a disappointing day for Bitcoin bulls. The largest cryptocurrency by market cap fell by over $2000 to an intraday low of $16 218 yesterday. Given Wednesday’s high of $19 490, BTC/USD lost over $3200 per coin in just two days. Instead of the new all-time high many expected, traders had to swallow a 16.8% drop.
This selloff can be attributed to natural profit-taking near the 2017 ATH resistance. Our preferred method of analysis, however, is a little more sophisticated. It is based on the Elliott Wave principle, which allows us to track the structure of the trend as it unfolds before us. This week, for example, it helped us stay ahead of Bitcoin’s violent plunge.

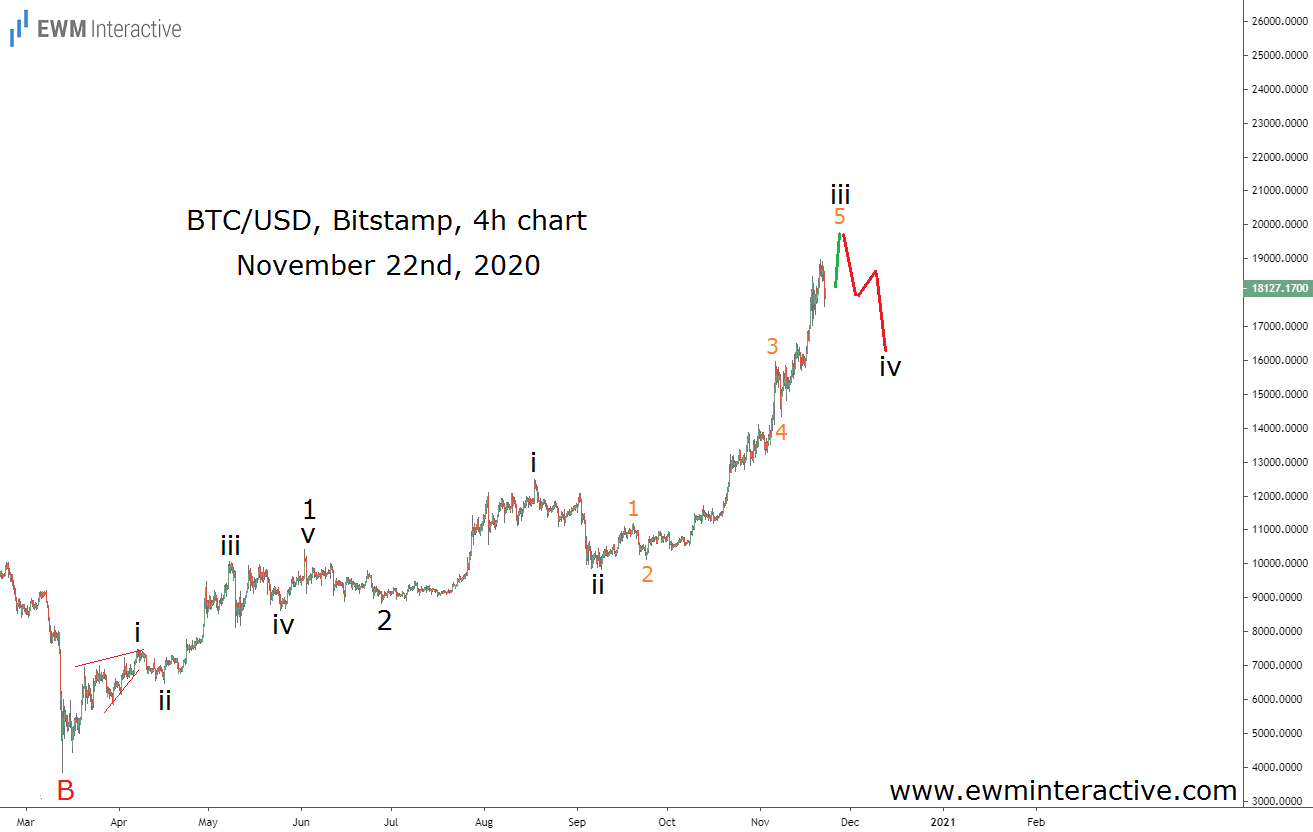
We thought the recovery from the March bottom was a five-wave impulse in progress. Trends don’t move in a straight line, though, and Bitcoin is no exception.
Knowing how the complete pattern should roughly look like, we assumed wave 3 is extending. In that case, its five sub-waves should also be quite notable. Given that a sequence of first and second waves labeled 1-2-i-ii was already in place, it made sense to label the following surge as wave iii of 3.
Bitcoin Shows How Quickly Things Can Change in the Crypto Market
This meant a corrective decline in wave iv was supposed to occur as soon as wave iii ended. Waves two and four are often similar in size, so the bears could potentially drag the price of Bitcoin to ~$16k. The exact top of wave iii was impossible to pinpoint, of course. Avoiding fresh new long positions near $19k in anticipation of a ~$3k drop, however, was still quite helpful. And as most things crypto-related, it didn’t take too long for the tides to turn.

Wave iii ended at $19 490 by completing the 1-2-3-4-5 pattern every impulse consists of. The theory states that a correction follows every impulse, so from that point on, the bears took over. For how long? It is too early to tell, but we will continue to trust Elliott Wave analysis to guide us going forward.
