- Bitcoin remains in a pivotal price range around $34,000, with an upcoming Fed decision likely to influence its next move.
- Ethereum has upward momentum, breaking resistance levels, and its trajectory depends on overcoming the key resistance at around $1,840.
- Bitcoin could form a golden cross ahead of a key week, while Ethereum is eyeing $1,910, $2,010, and $2,130 if it surpasses the $1,840 resistance.
Bitcoin has been in a consolidation phase around the $34,000 level following last week's rebound, maintaining its recent gains within a pivotal price range.
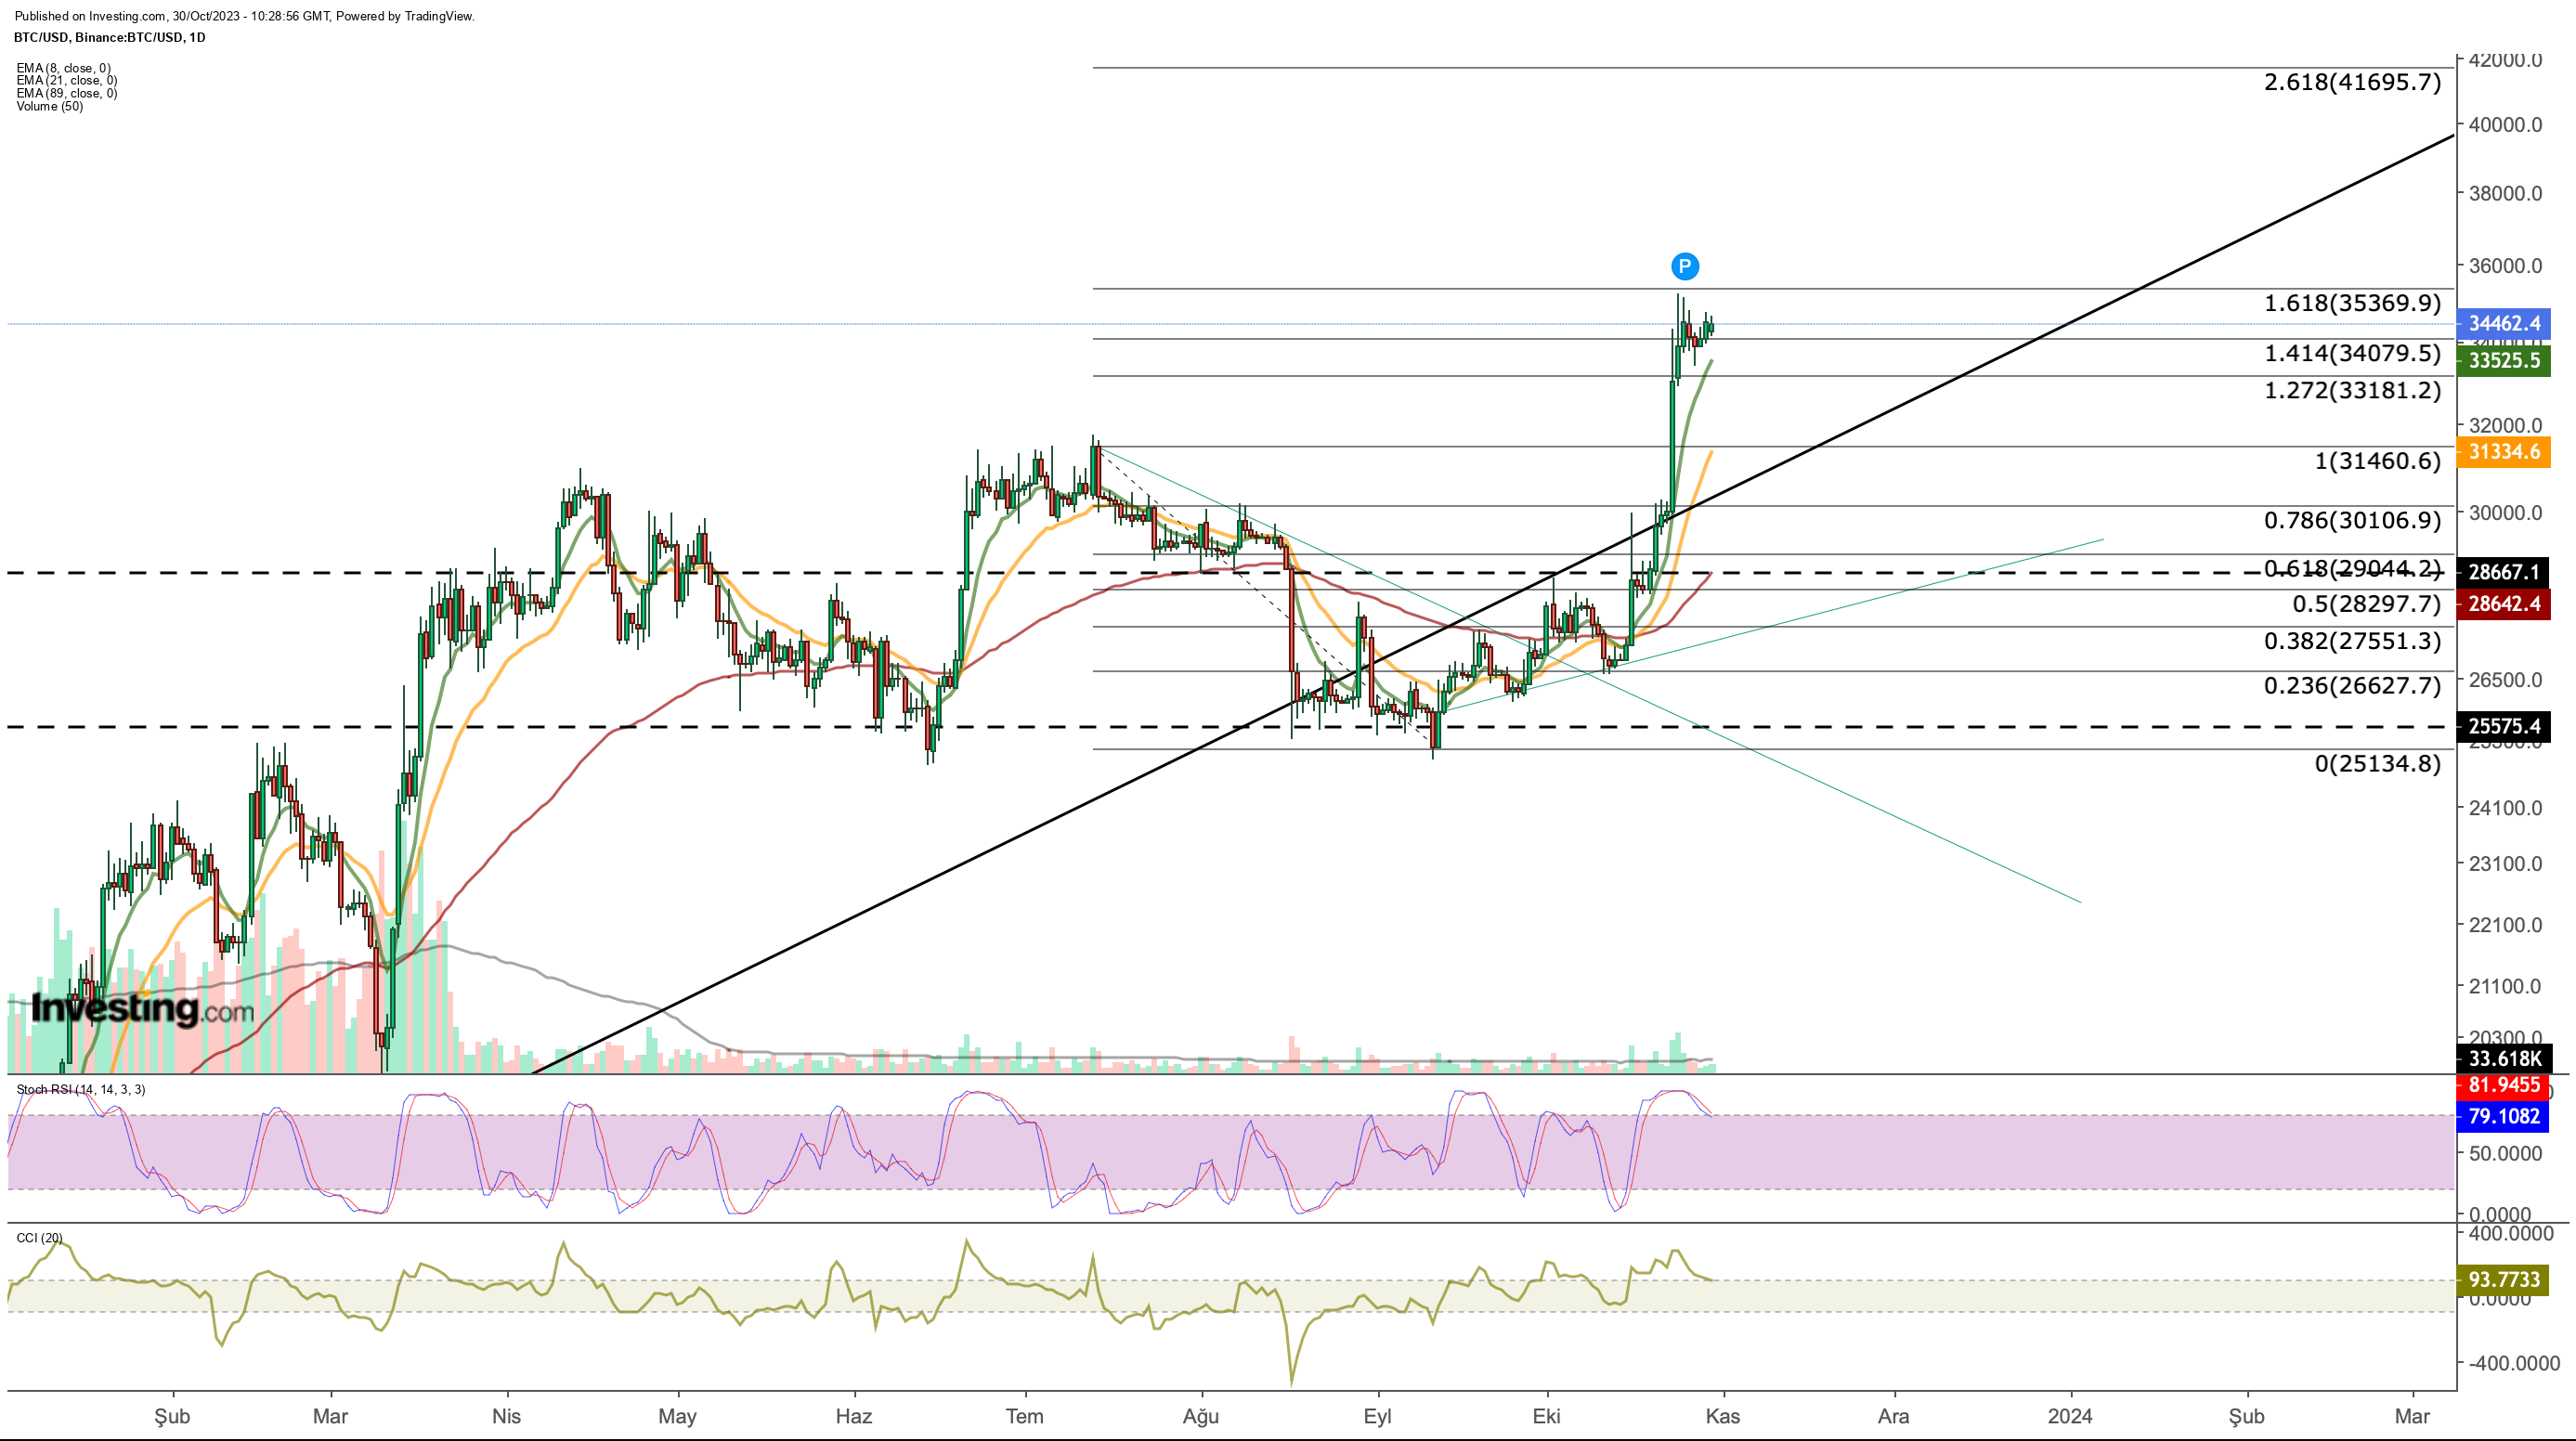
In our previous analysis, we noted that after breaking through the psychological resistance range spanning from $30,000 to $31,000 on substantial trading volume, Bitcoin advanced into the Fibonacci expansion zone between $33,000 and $35,000.
This zone corresponds to our tracking of the short-term downtrend. In the present scenario, it's evident that the cryptocurrency has temporarily halted its upward trajectory within this range.

While buyers and sellers enter the market monitoring mode in this zone, the BTC price continues to remain at the $34,000 limit. The next move may come after this week's Fed decision. The short-term outlook shows an intermediate resistance at $34,500 on average.
Failure to overcome this area may cause a pullback to $ 33,200 during the week. This price level is supported by the 8-day EMA and Fib 1,272. In addition, the Stochastic RSI, which started to lose momentum from the overbought level, is also a harbinger of a short-term pullback.
Nevertheless, it can be said that the positive outlook will be maintained as long as the indicator remains above 80. On the other hand, in daily closes below $33,200, it may become possible to test the July peak of $31,400.
In the event of a new wave of demand, if the resistance price, which corresponds to approximately $ 35,500, can be broken with daily closures, we can see that Bitcoin may form a new path towards $ 42,000.
However, the long-term chart shows another important resistance line on this path.
Bitcoin: Long-Term Technical View
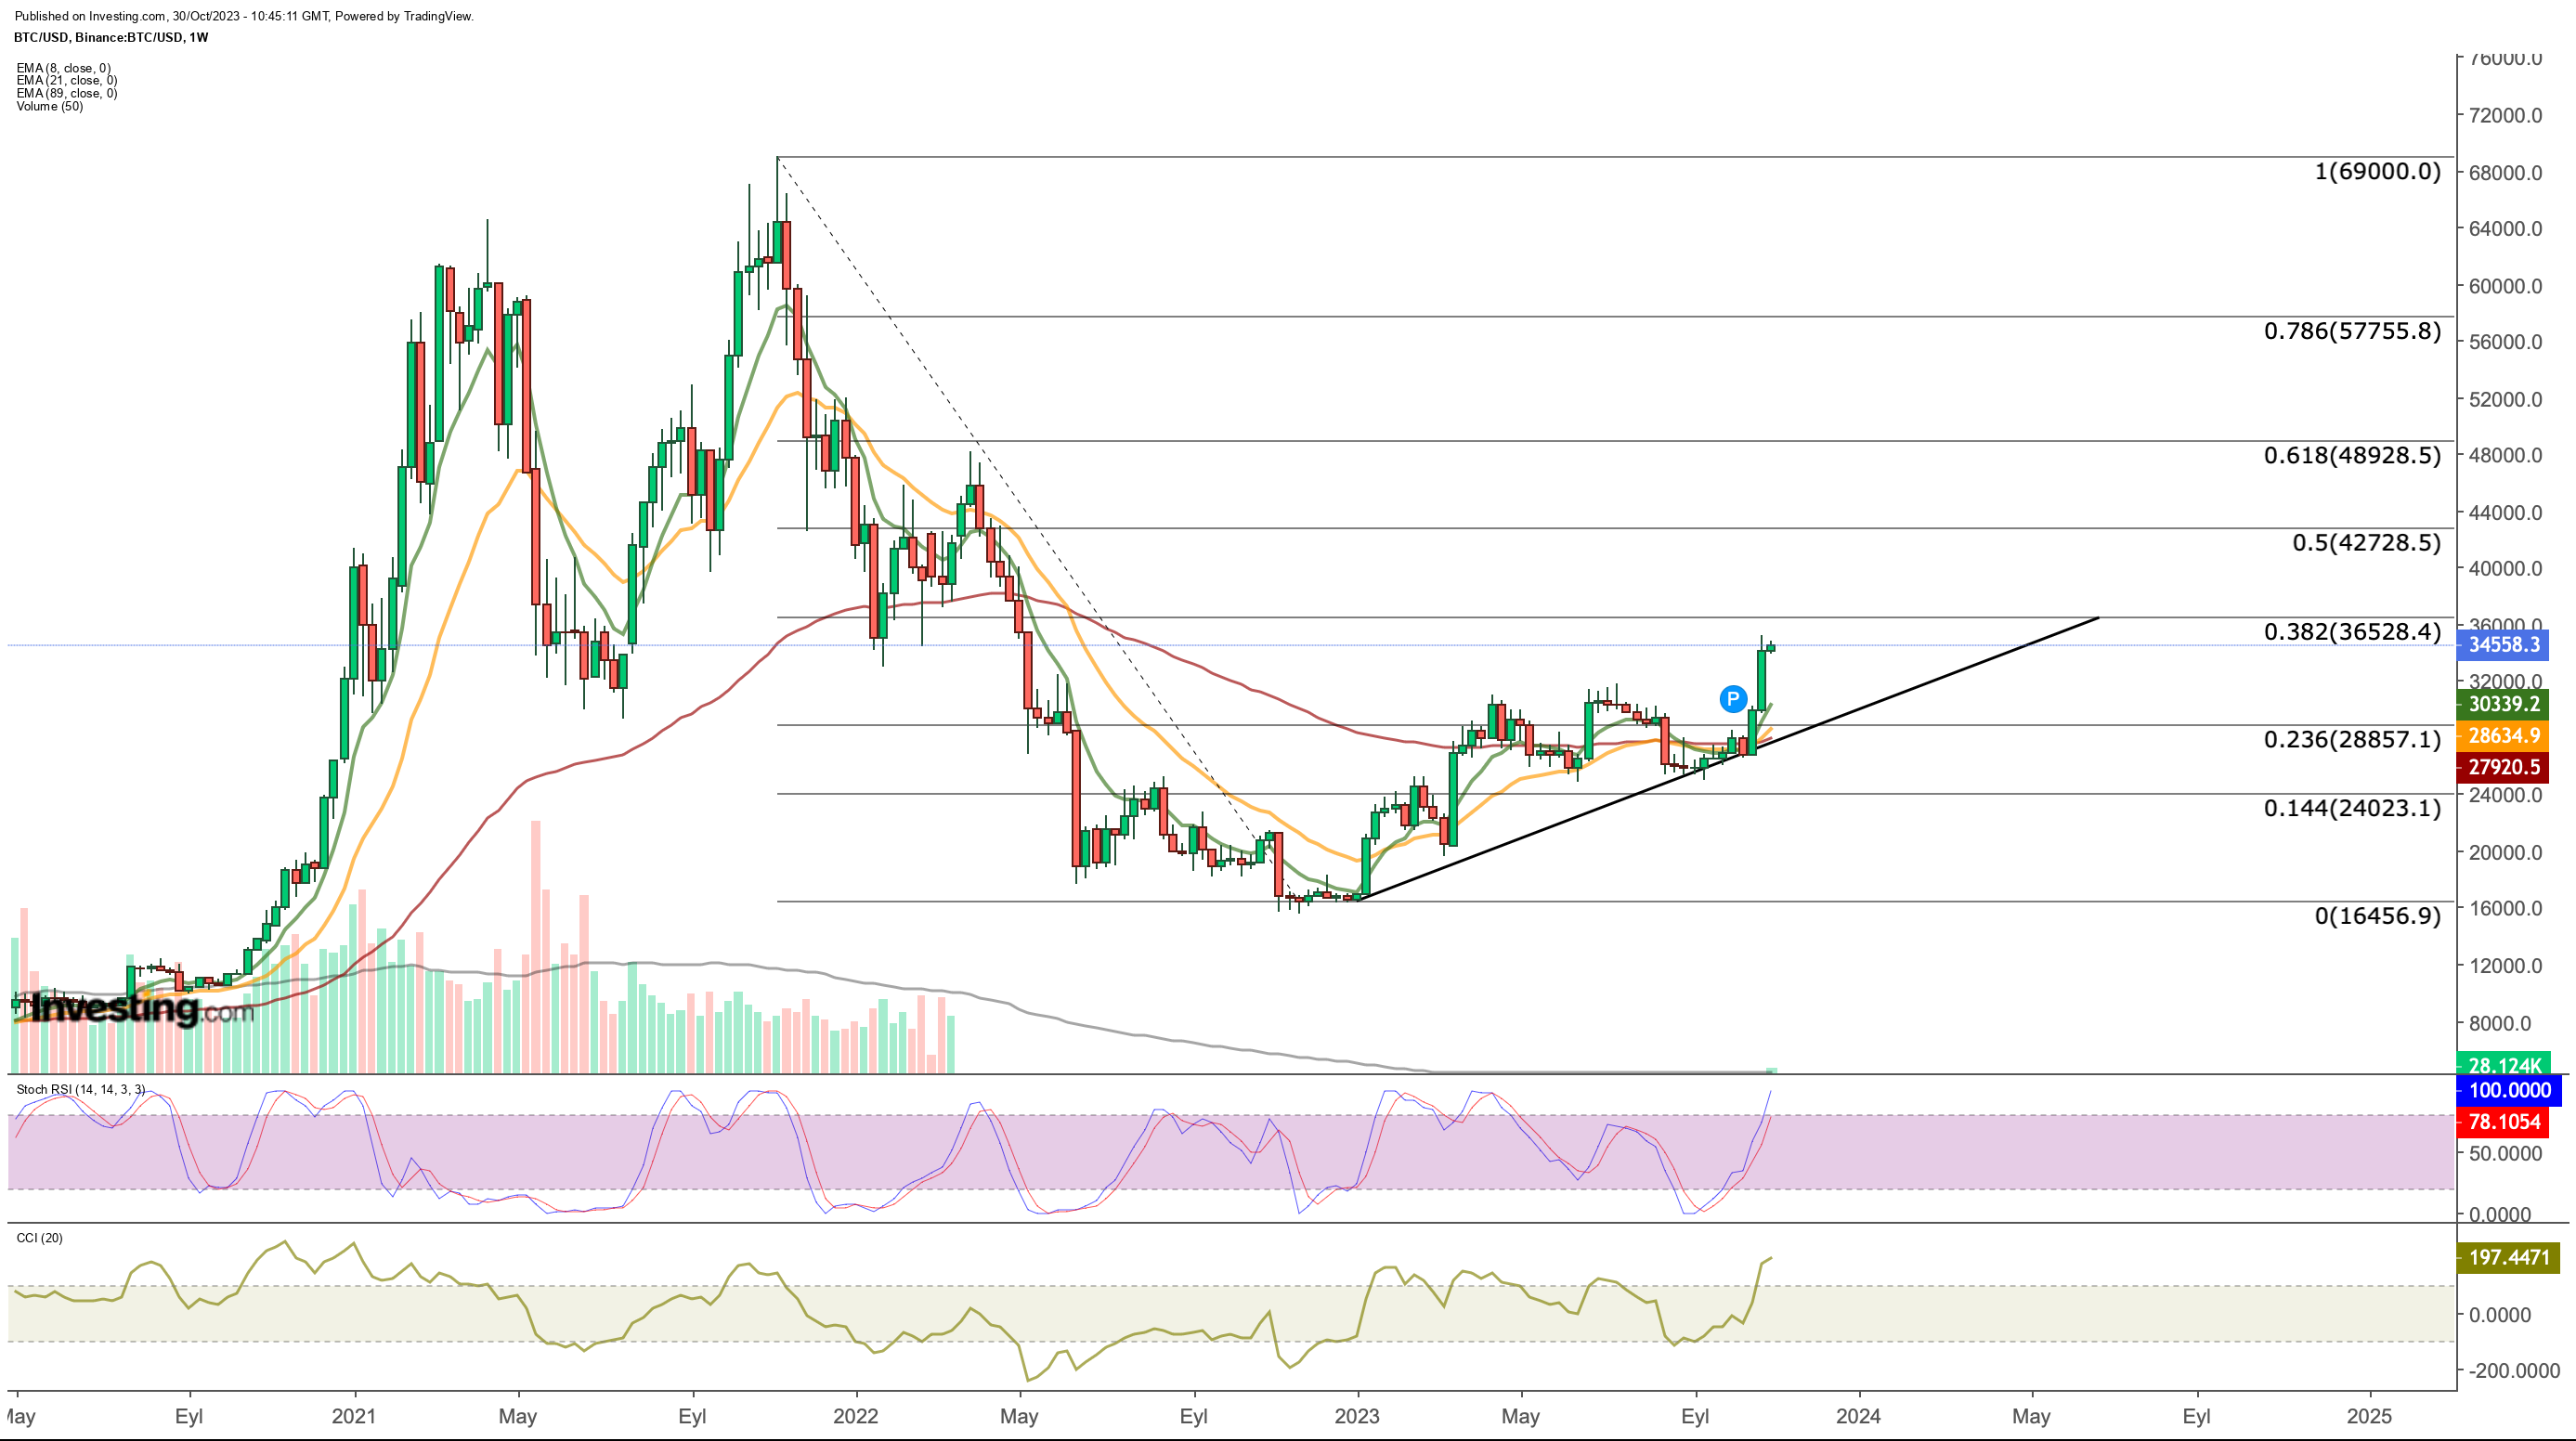
Let's check the weekly chart for a longer-term perspective. Bitcoin has been in a bear market for two years now, falling from a record high of $69,000 in November 2021 after the Fed signaled a change in monetary policy.
The cryptocurrency, which bottomed out in the $16,000 region during this period, has entered a gradual recovery phase over the last year.

Looking at Bitcoin's peaks and troughs over the last two years, it is seen that Fib 0.236 has turned into support as of last week. According to this approach, we see that the next obstacle is formed in the $ 36,500 region, which corresponds to Fib 0.382. Thus, according to Bitcoin's short and long-term assessment, the $35,500 - $36,500 range constitutes a very important resistance line.
Having successfully surpassed this price range, Bitcoin appears to be setting its sights on the $42,000 mark for the long term. What's particularly promising is the medium and long-term Exponential Moving Averages (EMA), which have recently demonstrated an upward crossover, indicating a bullish trend.
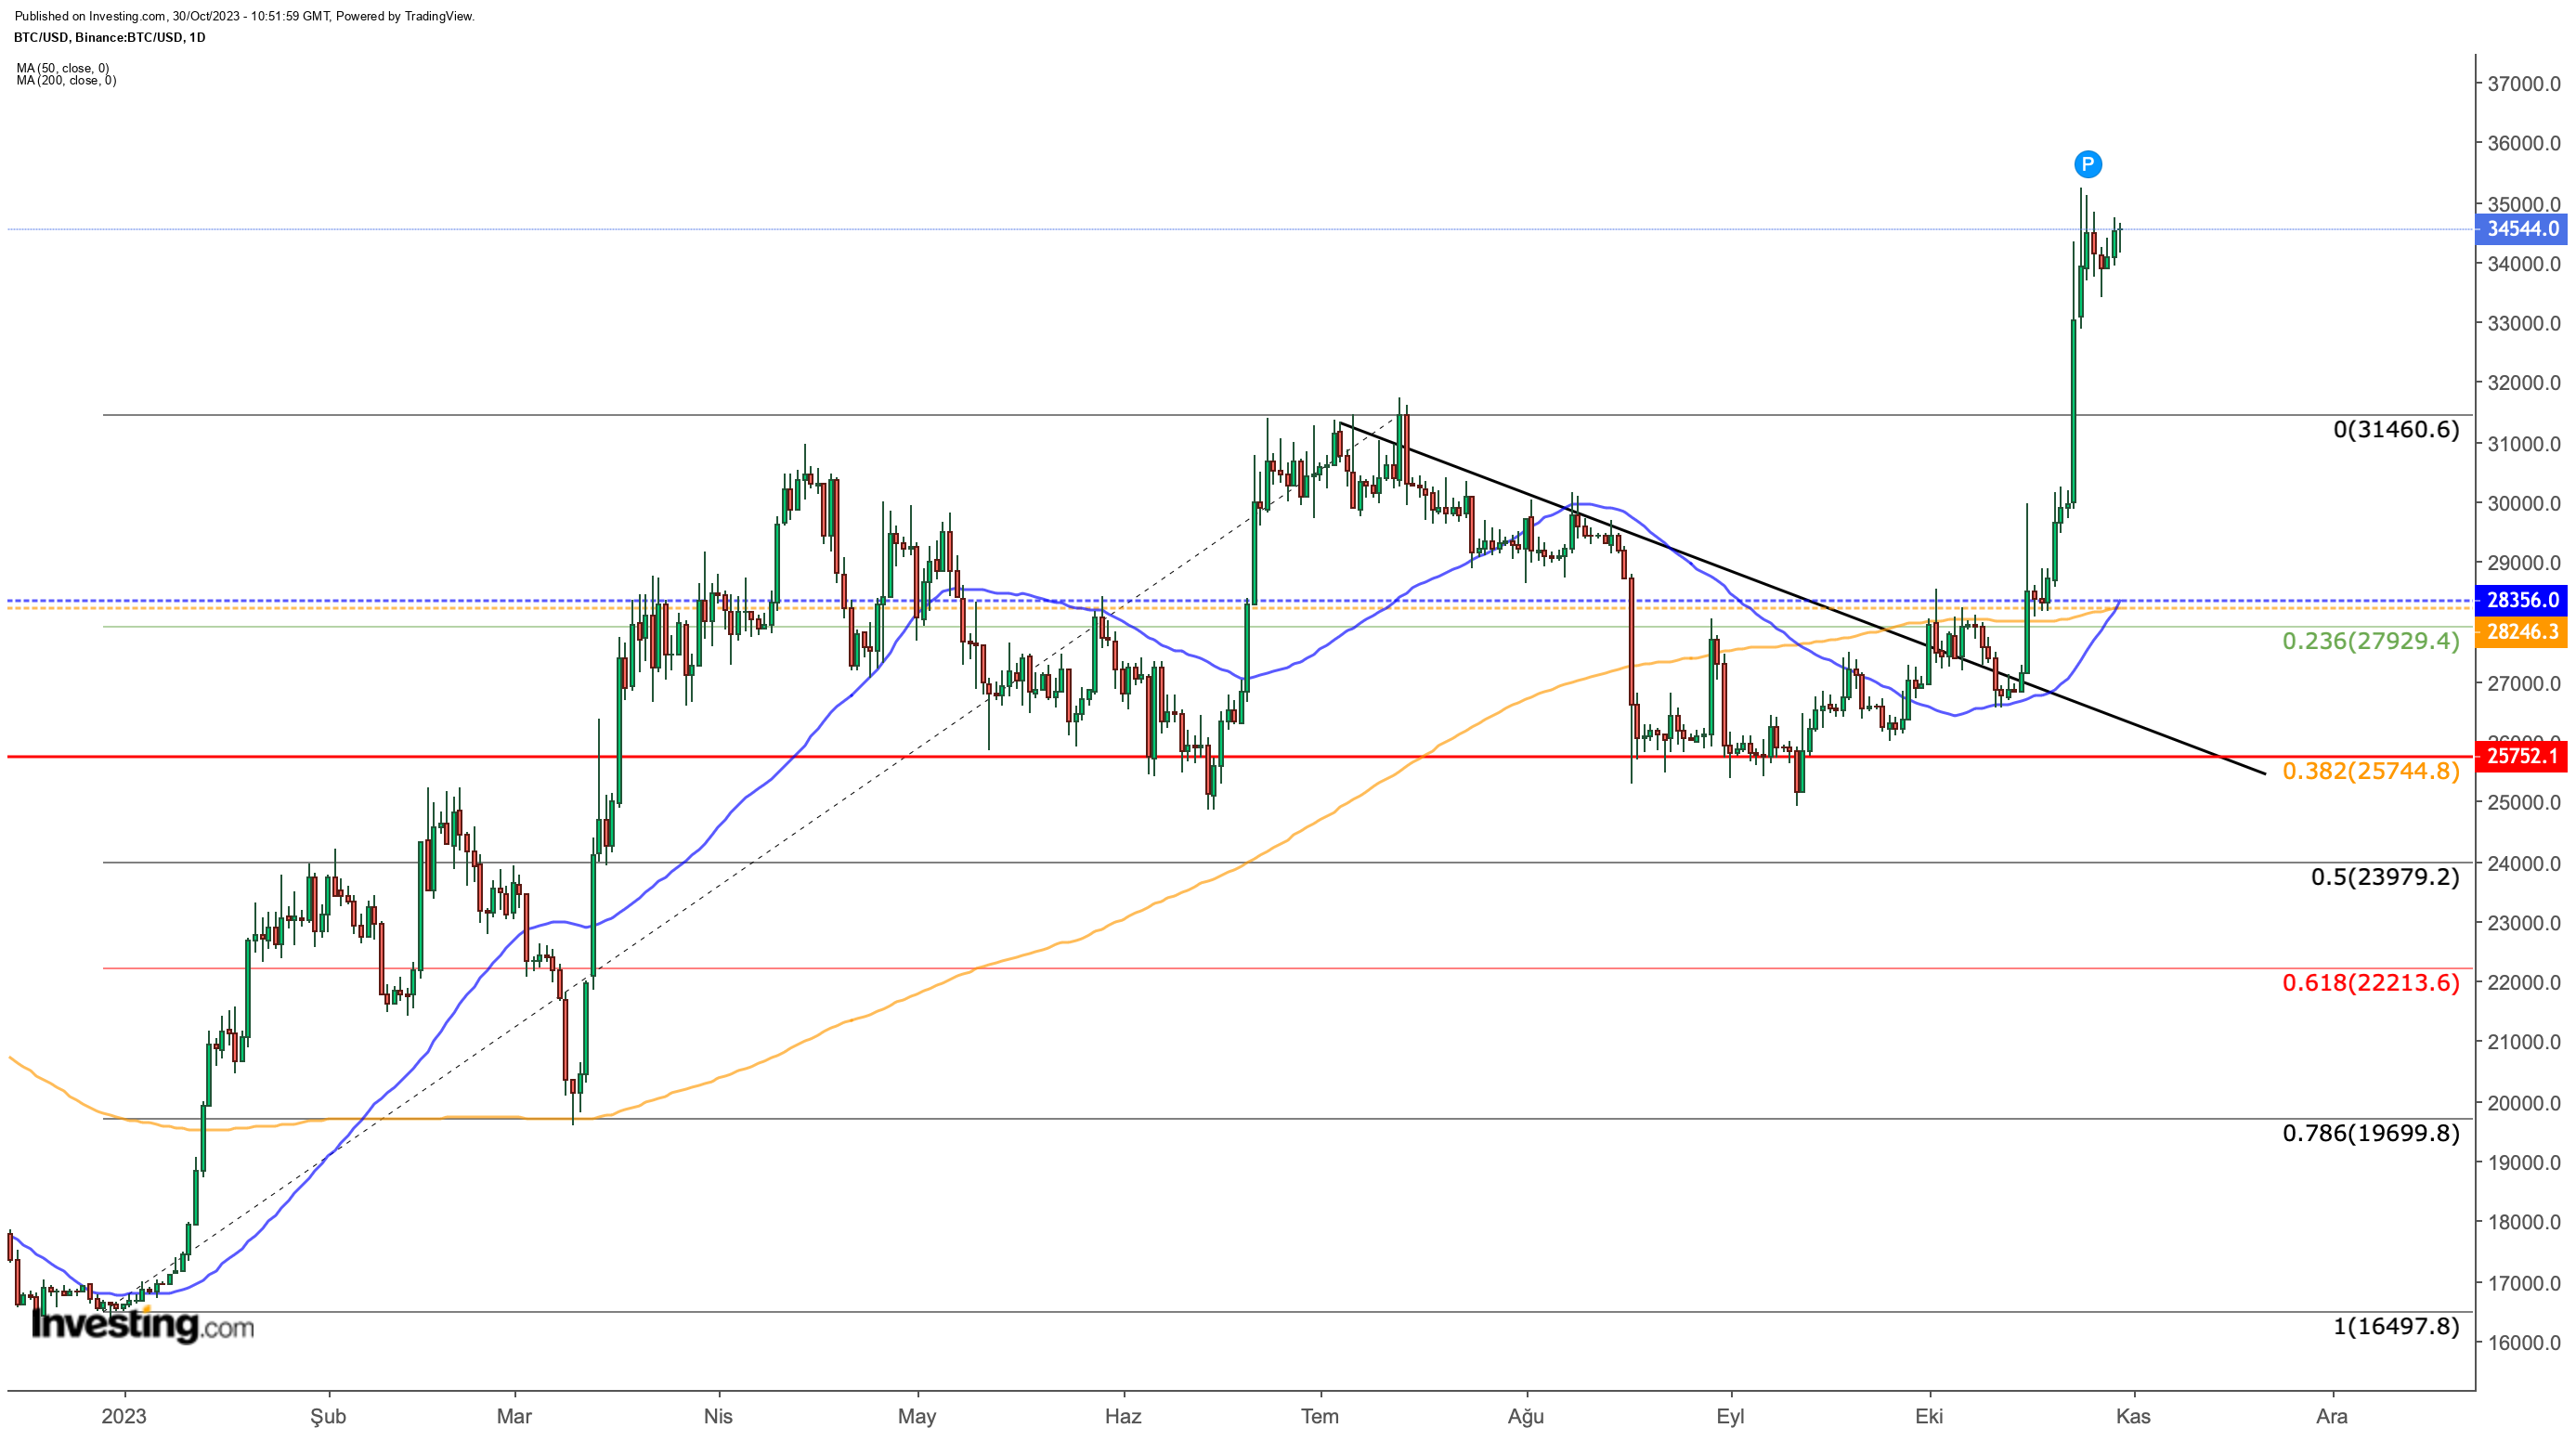
A significant point to note on the Bitcoin chart relates to the positions of the 50-day Moving Average (MA) and the 200-day MA. In September, Bitcoin experienced a "Death Cross" when its 50-day MA dropped below the 200-day MA, typically a harbinger of more substantial price declines.
However, this negative sentiment was averted as buyers managed to uphold Bitcoin's value above the $25,700 support level, bolstering optimism for future prospects. Come October, Bitcoin has shifted up a gear and is now about to form a "Golden Cross" on the verge of a positive crossover at key moving averages.

While technically the bounce appears to be stronger, this may be stronger than the "Death Cross" effect for the largest cryptocurrency to accelerate its uptrend as long as it holds on to short-term support levels.
Ethereum: Can the Upward Momentum Continue?
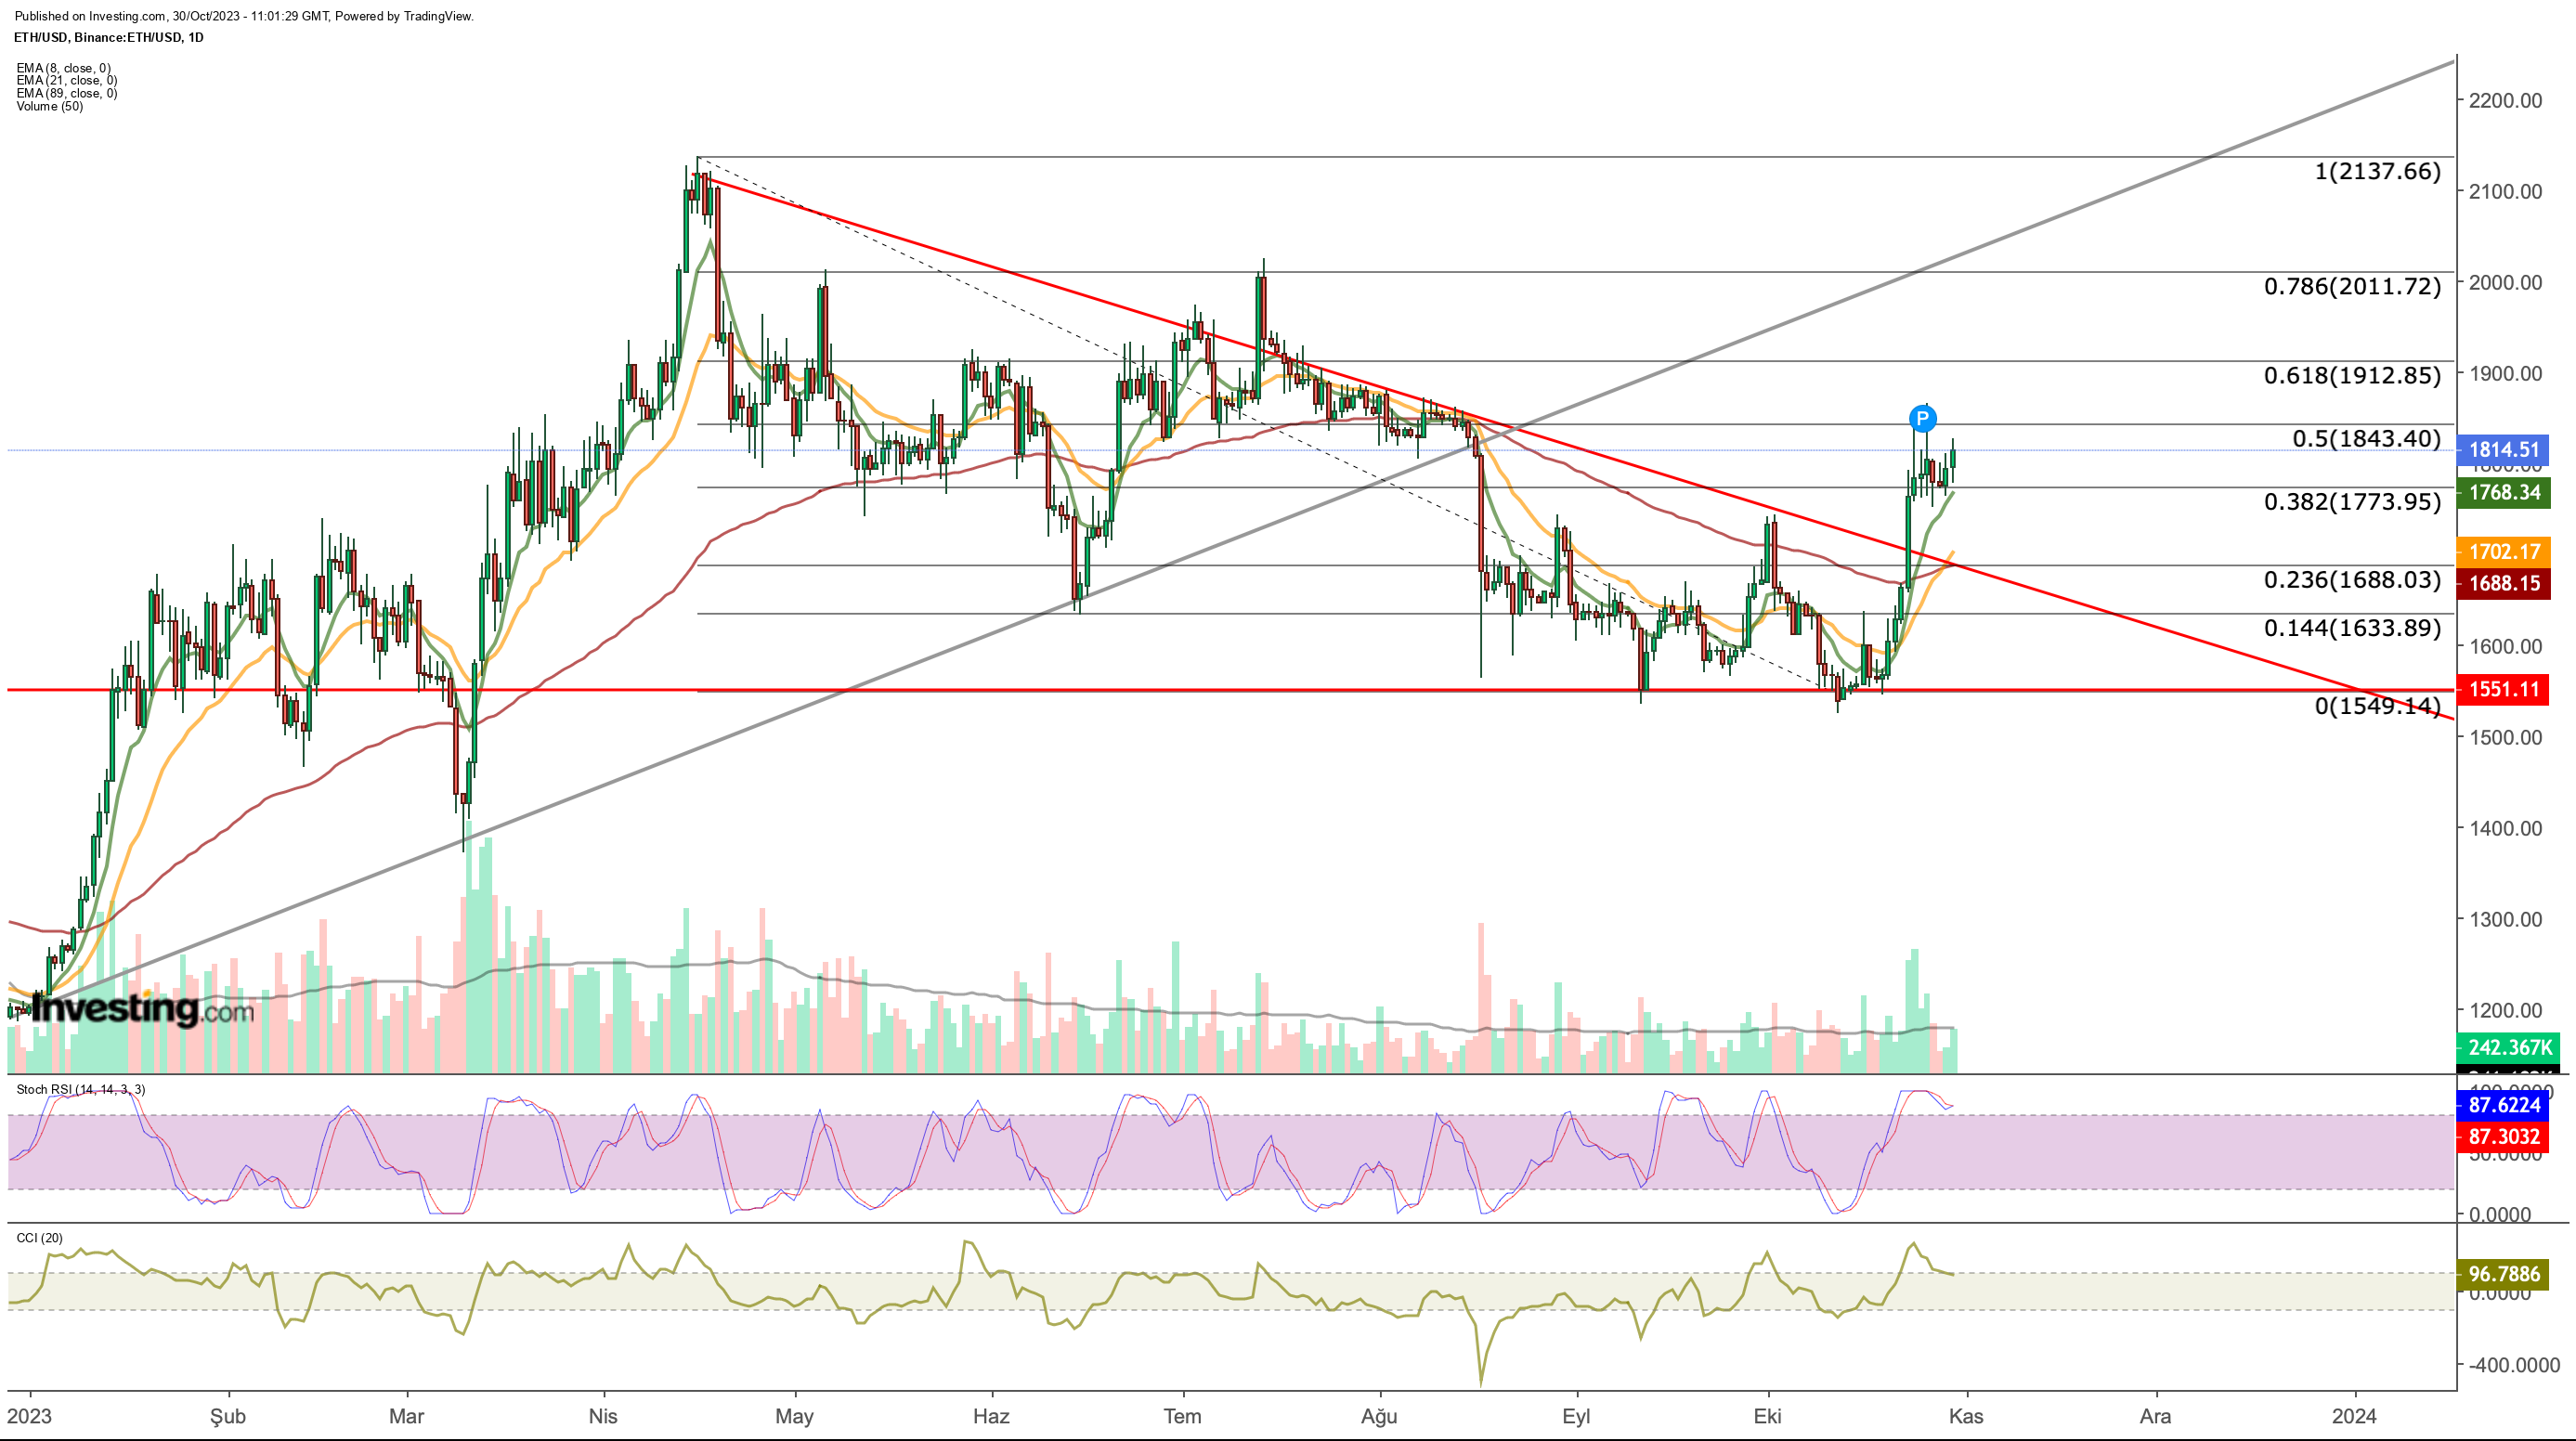
EthereumWhile testing the ideal correction level at $ 1,550 in the last 3-month period, it was seen that demand remained alive at this point. In the upward momentum in October, Ethereum, which broke the resistance line extending up to $1,660, also took an important step toward recovery by breaking the falling triangle pattern of April origin upwards.

Currently, Ethereum (ETH) appears to have successfully transformed the $1,770 resistance level into a support base, and its trajectory hinges on surmounting the resistance formed at approximately $1,840 for a sustained upward trend.
In the event of daily closes above this key level, the subsequent target levels become 1.910, 2.010, and 2.130. Conversely, if daily closures fall below $1,770, a retest of $1,680 may occur, aligning with the downtrend's origin in April.
***
Disclaimer: This article is written for informational purposes only; it does not constitute a solicitation, offer, advice, or recommendation to invest as such it is not intended to incentivize the purchase of assets in any way. I would like to remind you that any type of asset, is evaluated from multiple points of view and is highly risky and therefore, any investment decision and the associated risk remains with the investor.

