While a critical support level contains Bitcoin’s price, Ethereum looks primed for new highs.
Key Takeaways
- Bitcoin has endured an 18% correction over the past two weeks and now sits on top of stable support.
- Ethereum whales are slowly reentering the network as a number of new buy signals pop up in the market.
- Despite the significant losses incurred recently, it seems that both cryptocurrencies are poised to rebound.
Sidelined investors appear to be taking advantage of a recent downswing to reenter the crypto market. The sudden spike in buying pressure could help Bitcoin and Ethereum prices recover.
Bitcoin Holds Above Crucial Support
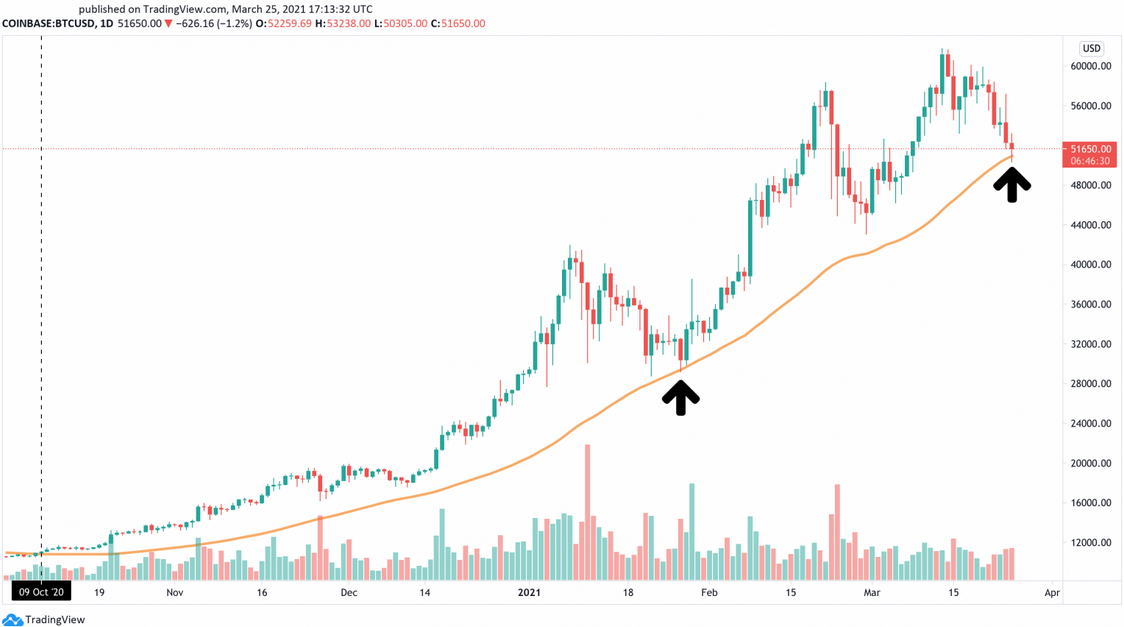
Bitcoin suffered a significant correction after rising to a new all-time high of $61,800 on Mar. 13. Its price dropped by more than 18% to hit a low of $50,300 recently. The downswing appears to have been contained by the 50-day moving average on BTC’s daily chart.
That indicator has played a vital role in Bitcoin’s price performance ever since it became came into play on Oct. 9, 2020. It has held through one of Bitcoin’s most significant retracements since that date, serving as a rebound point that drove prices to record highs.
Now that BTC is once again testing the 50-day moving average, a similar market reaction could occur. Bouncing off this support level could push the market value of Bitcoin toward a new all-time high above $70,000. But to do so, Bitcoin would have to slice through a massive supply barrier that lies ahead.
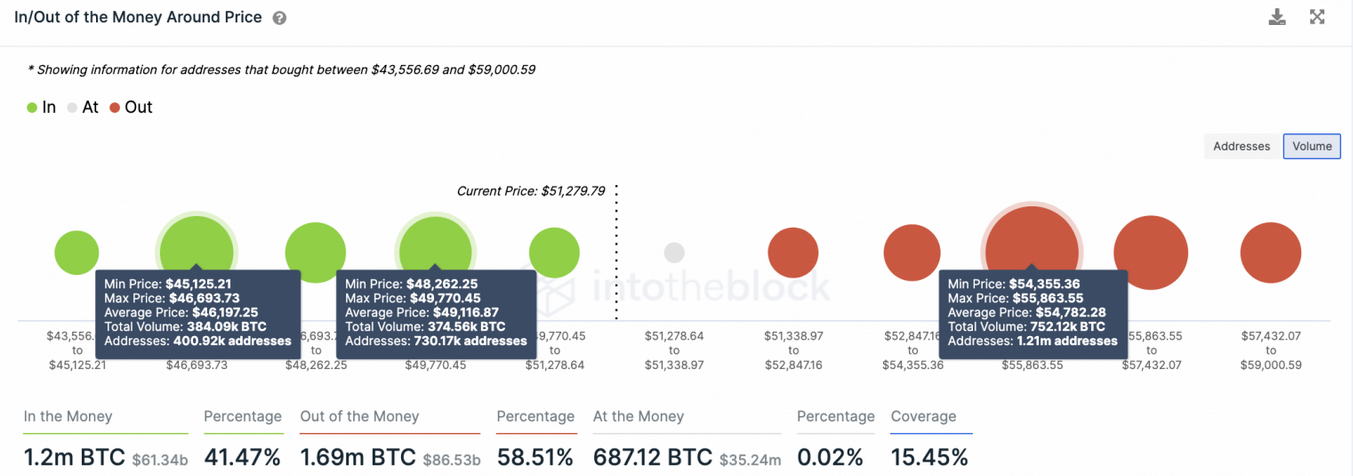
IntoTheBlock’s In/Out of the Money Around Price (IOMAP) model reveals that the $54,800 level represents a significant area of resistance. Over 1.20 million addresses previously purchased more than 752,000 BTC around this price point.
As such, only a daily candlestick close above this price hurdle will help confirm the optimistic outlook.
It is worth noting that further price appreciation may prove challenging from an on-chain metrics perspective.
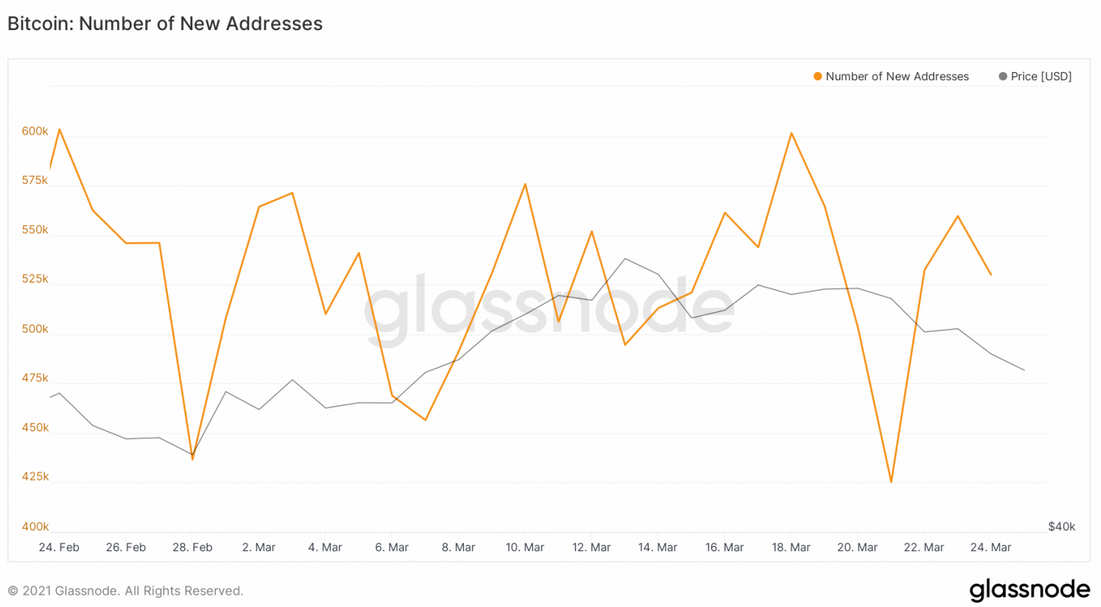
Market participants do not seem to be attracted to the current price action, as the number of new daily addresses on the Bitcoin blockchain is plummeting. Roughly 530,000 new addresses joined the network today, representing an 11.80% decline in the past week.
This is a negative sign: network growth is often regarded as one of the most accurate predictors of price. Usually, when the network shrinks for a prolonged period, prices tend to tumble.
If Bitcoin fails to hold above the 50-day moving average, a steeper pullback is likely imminent.
The IOMAP cohorts show that the two most critical support areas underneath this cryptocurrency sit at $49,000 and $46,200. Given the amount of interest around these price points, they may have the ability to prevent BTC from going through a steeper correction.
Ethereum Screams Buy
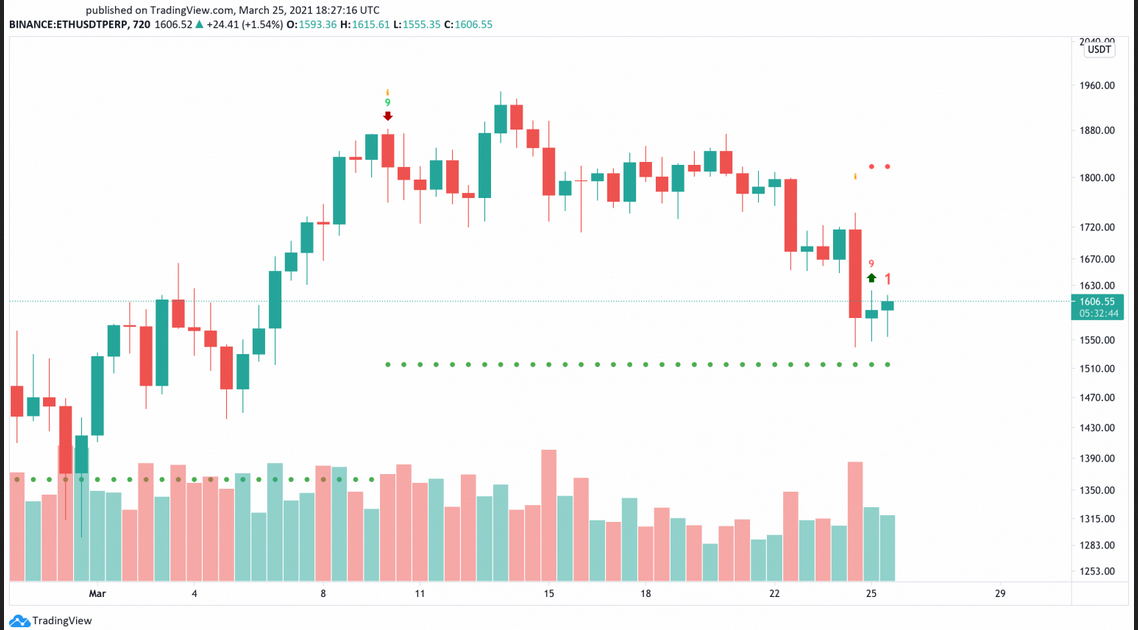
Ethereum has also incurred losses, falling by 20% since Mar. 13 and dropping to a low of $1,540. This could represent a market bottom as multiple buy signals are popping up across the board.
For instance, the TD Sequential indicator presented a buy signal in the form of a red nine candlestick on ETH’s 12-hour chart. The bullish formation suggests that a spike in demand for Ethereum may see prices rise for one to four candlesticks. But if the upward pressure is strong enough, Ethereum might start a new upward countdown.
The buy signal will be confirmed when a green two candlestick starts trending above a preceding green one candle.
The Market Value to Realized Value (MVRV) index also favors bullish sentiment. This fundamental index measures the average profit or loss of addresses that acquired Ether in the past month. Each time the 30-day MVRV moves below 0%, a bullish impulse tends to follow.
The 30-day MVRV ratio is now hovering at -3.93%, indicating ETH is currently undervalued. The lower the MVRV ratio becomes, the higher the buying pressure behind Ethereum.
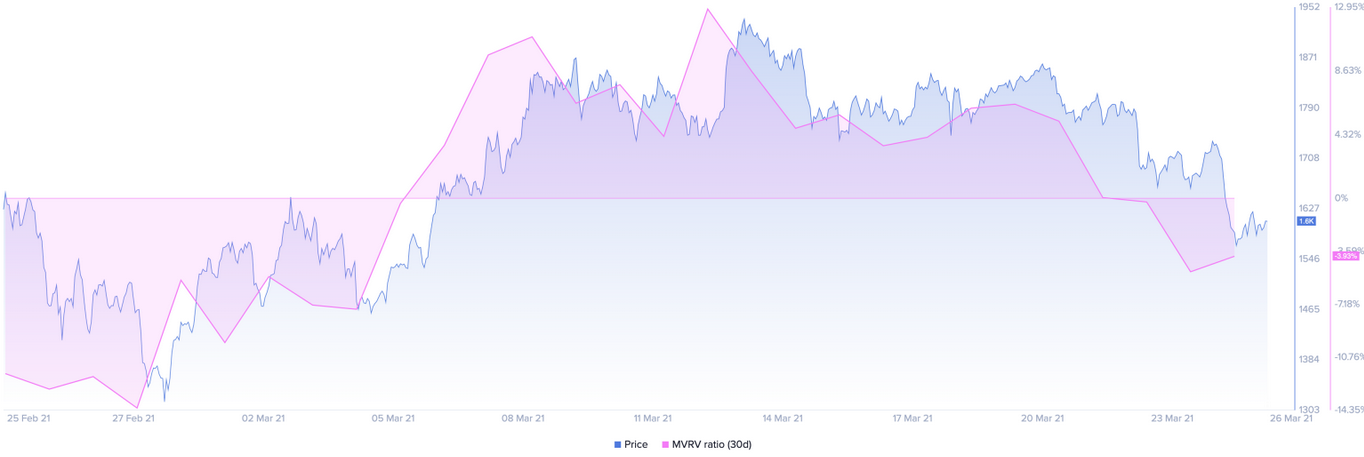
While these technical and fundamental indicators turn bullish, large investors appear to be rushing to add more Ether to their portfolios.
Santiment’s holder distribution chart shows that over the past 48 hours, buy orders behind Ethereum have been filled.
The analytics firm recorded a significant spike in the number of addresses with millions of dollars in ETH, colloquially known as “whales.” Addresses holding 10,000 to 100,000 ETH have shot up by nearly 0.60%, and roughly six new whales have joined the network.
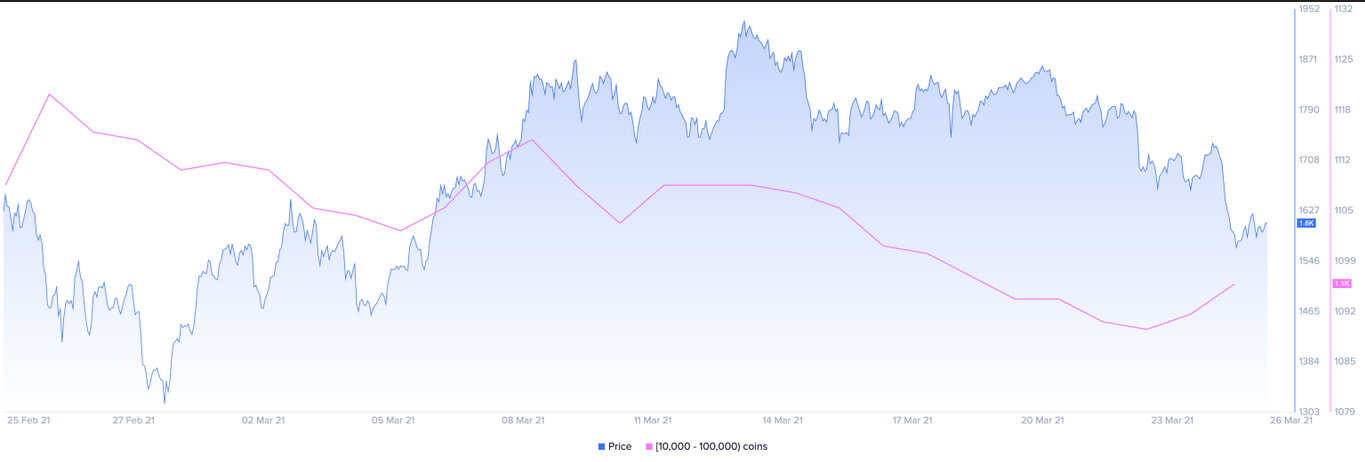
The increasing presence of large ETH holders may seem insignificant at first glance. However, when considering that these whales hold between $16 million and $160 million in ETH, the sudden spike in buying pressure can translate into millions of dollars.
If the buying spree continues, ETH may have the ability to advance further and reach a new all-time high of $2,500.
