- Both Bitcoin and Ethereum tested their resistances last week
- However, bulls failed to gather necessary momentum for a breakout
- Both cryptos should look for a new test of the resistances this week
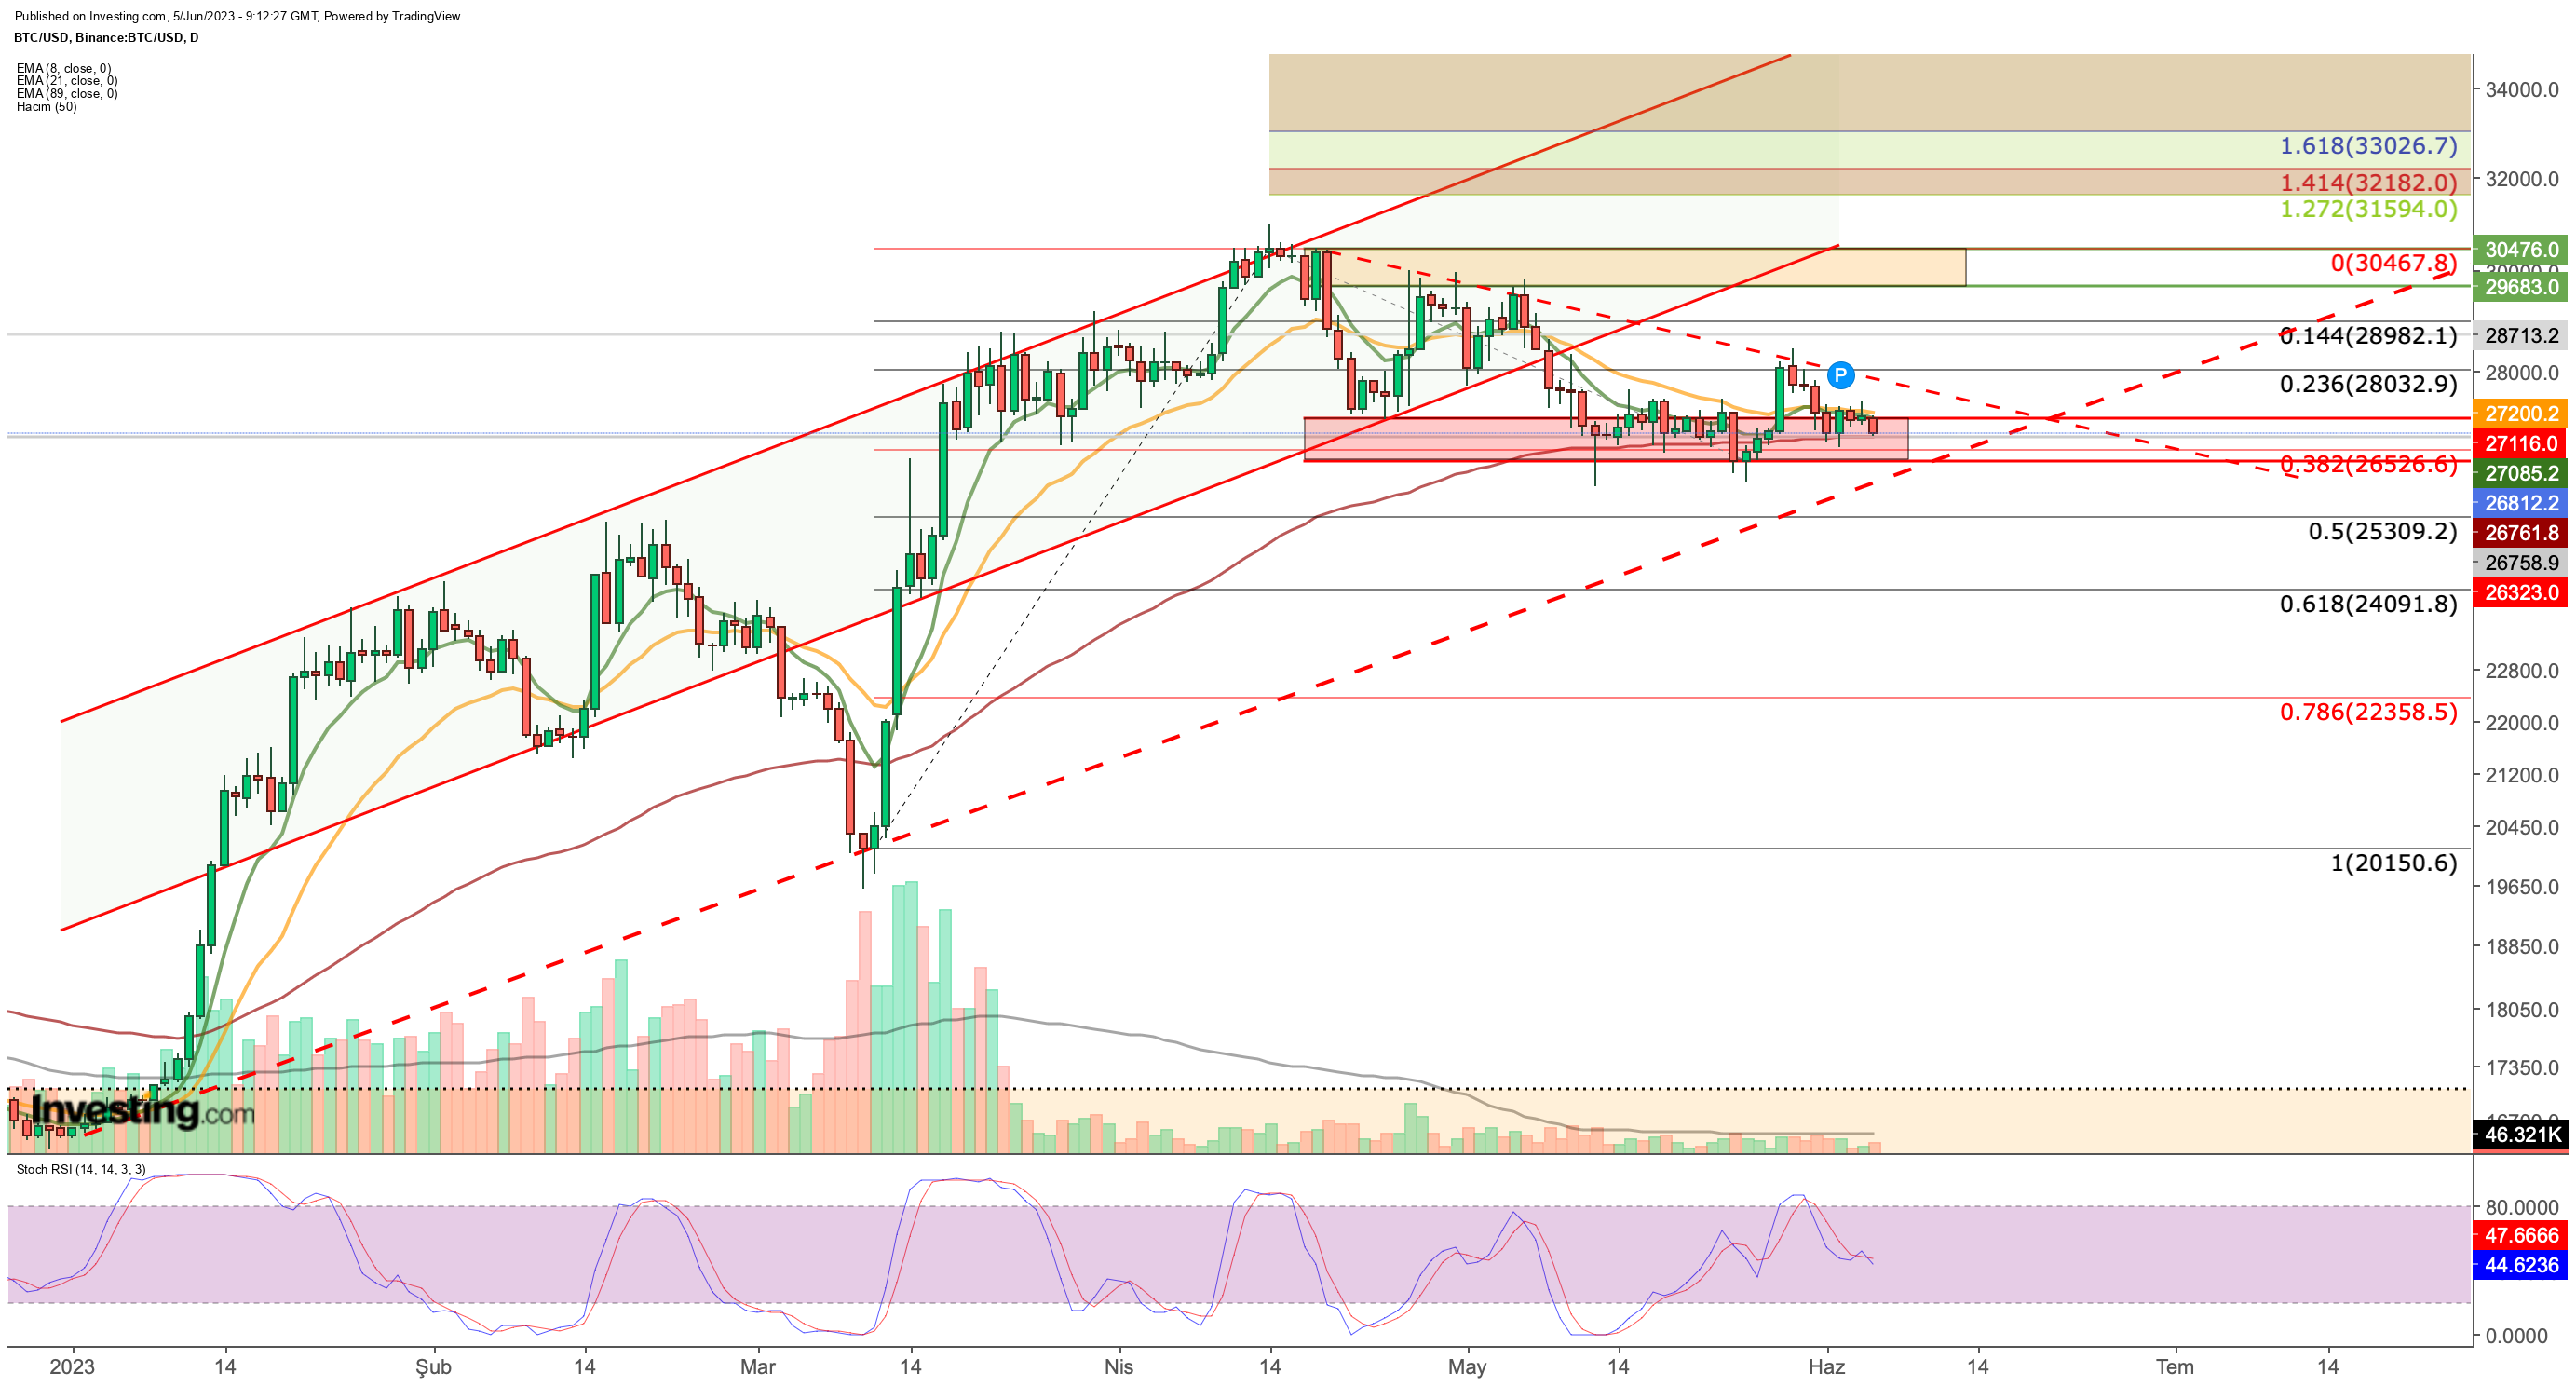
Bitcoin has maintained a narrow trading range between $26,300 and $27,300 for about a month. The declining trading volume suggests a consolidation phase for the cryptocurrency.
However, price movements breaching the range have lacked the necessary momentum to spark a significant trend reversal.

BTC recently encountered resistance at the $28,000 level. Currently, the $26,500 level has acted as a reliable support. Additionally, the $26,300 level, which has been tested twice within the past month, is a crucial support level.
A close below $26,500 this week could result in the cryptocurrency breaking its 2023 uptrend. This breach could be a trend reversal for BTC, and a new downtrend targeting support levels at $25,300, $24,100, and $22,350, could ensue.
The cryptocurrency has to stay above $27,100 to avoid downside risks. Such a breakthrough would indicate an increase in buyer volume, providing BTC with the strength to surpass the $28,000 resistance level.
In the event of a potential recovery, BTC may encounter intermediate resistance around $29,000, following the $28,000 mark. Subsequently, close attention will be paid to the main resistance zone ranging from $29,600 to $30,500.
This zone aligns with the midline of the ascending channel movement observed in 2023 and will be a critical price range to monitor for the continuation of the uptrend.
On the daily chart, moving averages support the $26,500 - $27,100 band as an important support zone. BTC price is currently between the short-term EMA values.
In this case, the EMA value positioned at $26,500 confirms that this level is a critical support point. At the same time, the coincidence of the 89 EMA with the bottom line of the ascending channel increases the probability of a breakout.
To summarize, Bitcoin's net close of the day below $26,500 or a drop in volume technically indicates that the price could trigger a rapid decline.
Ethereum
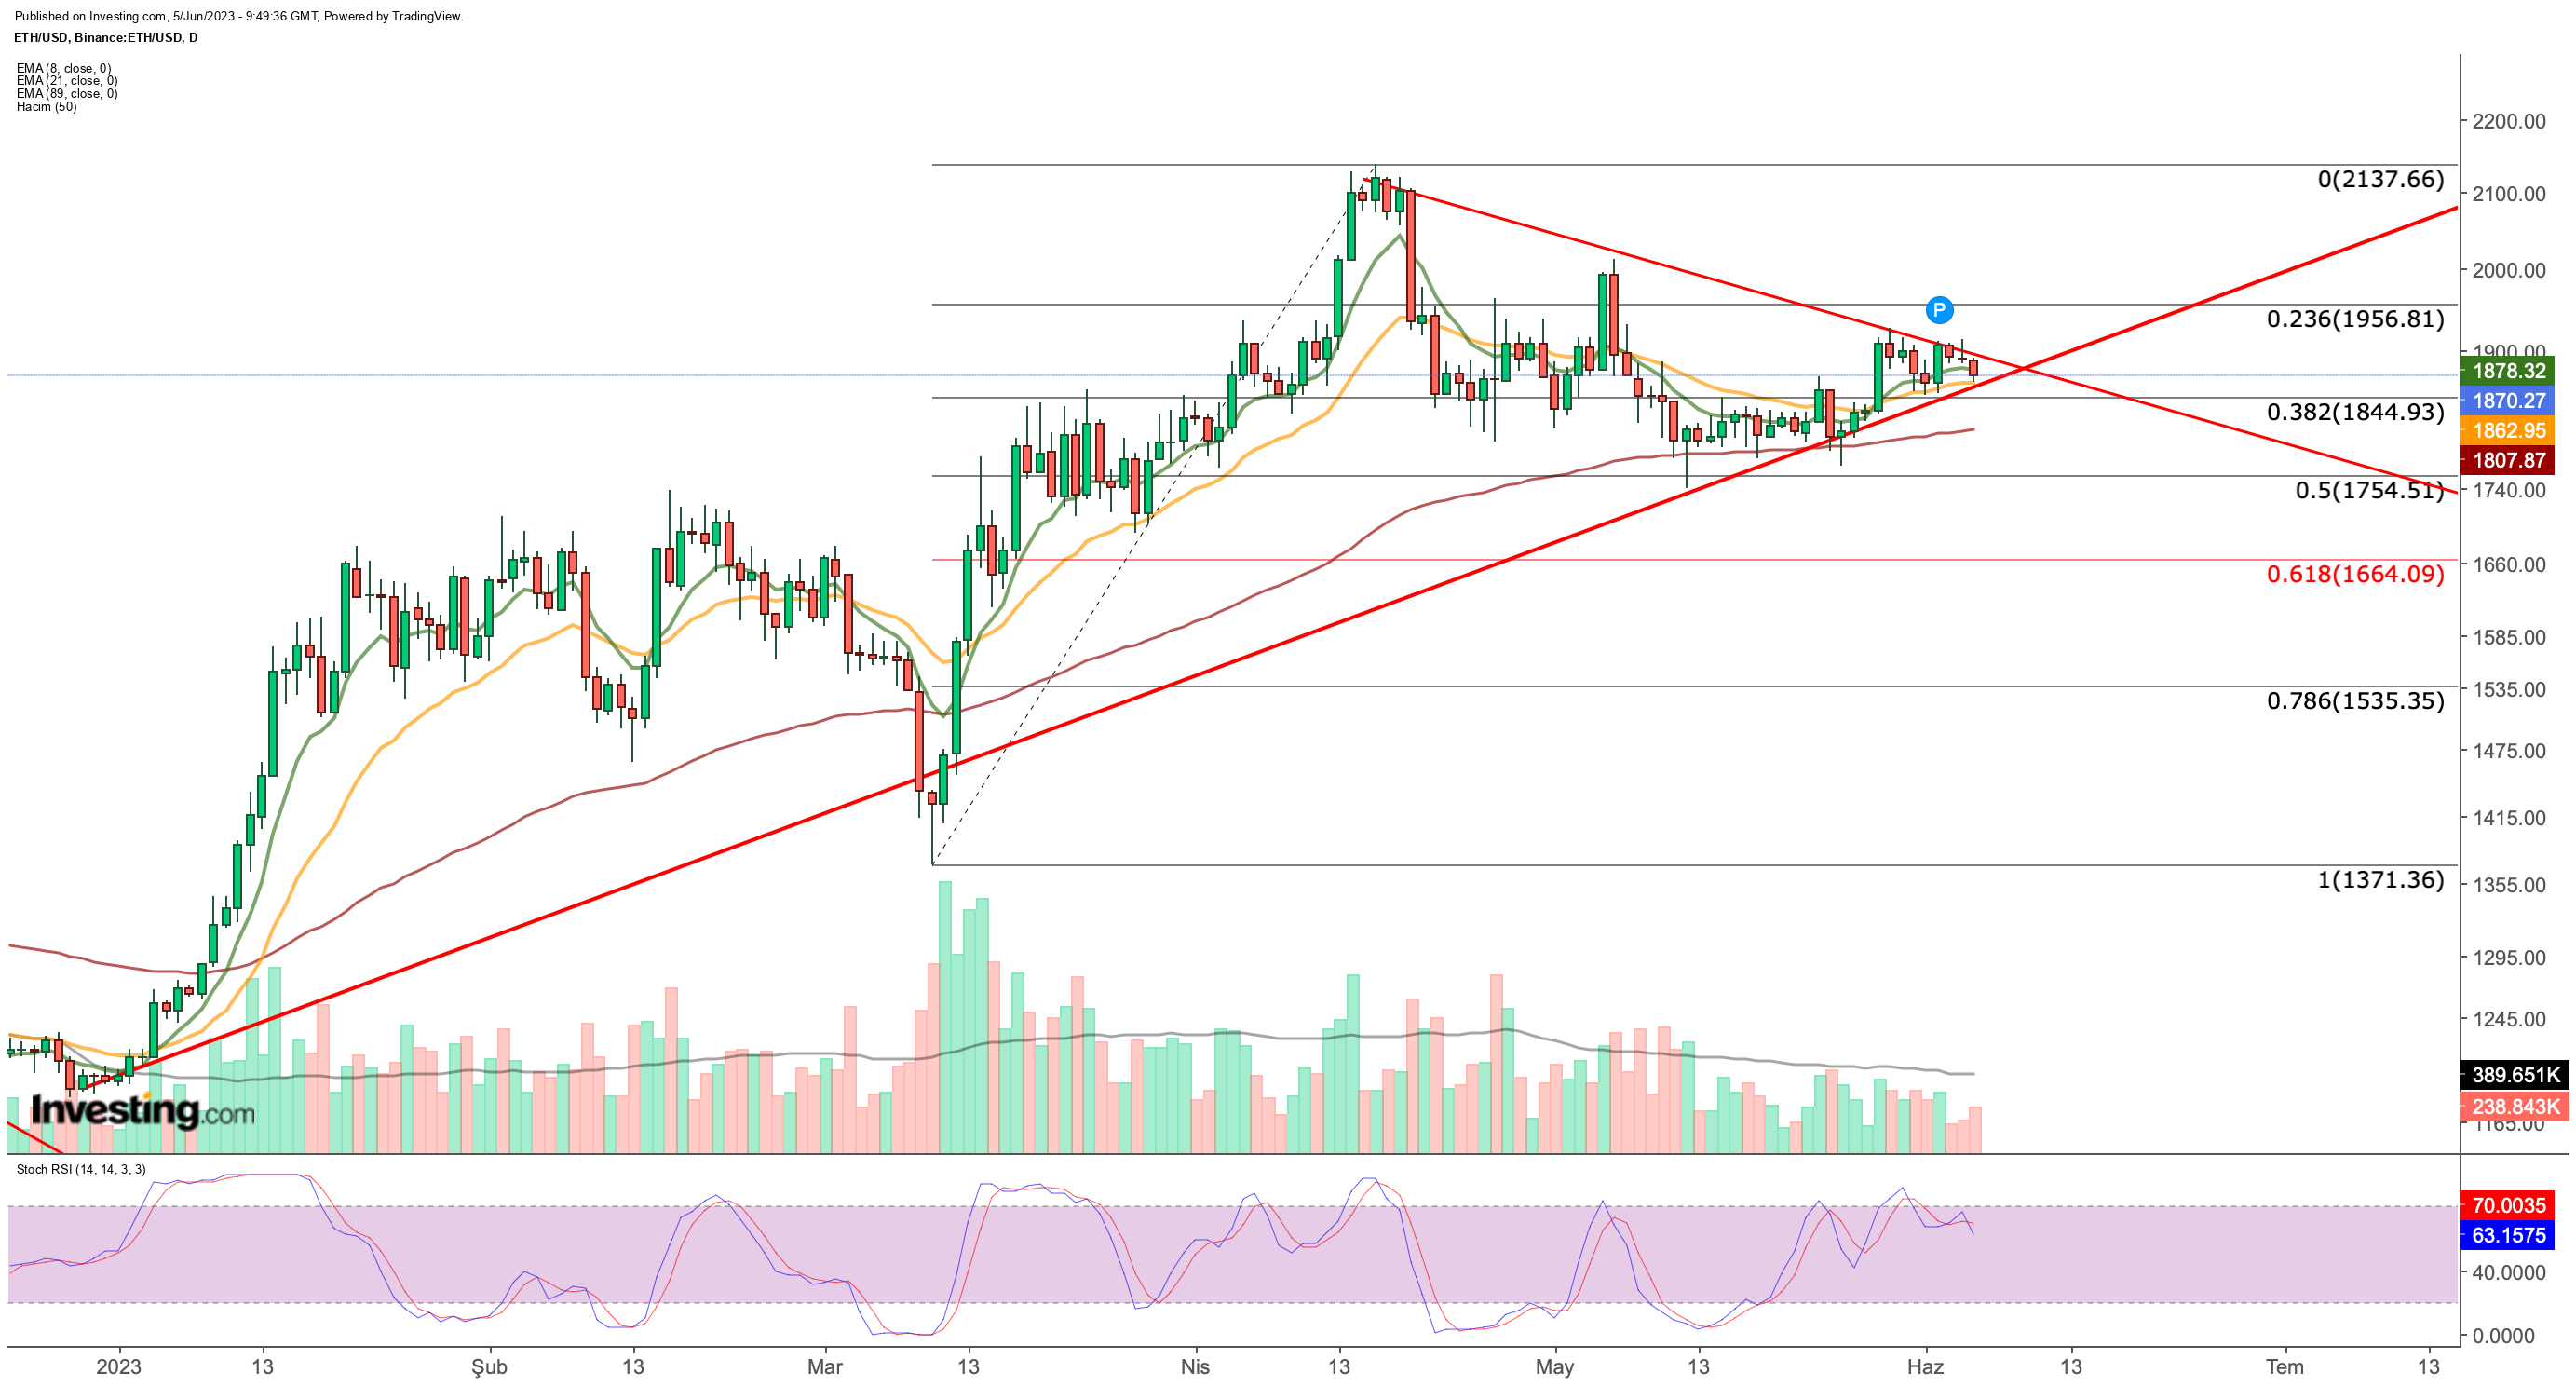
Ethereum enters the week following the ascending trend line. However, it faces challenges in breaking the short-term downtrend line that started in mid-April.

The ETH daily chart currently shows a triangle formation, suggesting that the price may soon experience increased volatility. If ETH closes below $1,850, it could indicate a downward breakout from the triangle, leading to a potential decline toward $1,660.
On the other hand, if ETH opens and closes above $1,950, it would confirm an upside breakout and may set a target of $2,100, which is a key level.
InvestingPro tools assist savvy investors in analyzing stocks. By combining Wall Street analyst insights with comprehensive valuation models, investors can make informed decisions while maximizing their returns.
Start your InvestingPro free 7-day trial now!
Disclaimer: This article was written for informational purposes only; it does not constitute a solicitation, offer, advice, counsel, or recommendation to invest, nor is it intended to encourage the purchase of assets in any way.

