While not many expected to see Bitcoin breaking the major resistance at $4200, Bitcoin rose by 22 percent in a single day. This might seem like a belated April fool to the bears, however, Bitcoin actually rose from $4188 to $5107, breaking all the resistances with massive volume.
Although this is indeed very bullish for the cryptocurrencies market, heavy price movements are often followed by a correction wave. With the current outlook of Bitcoin, we might see such a correction very soon. Let’s dive right into the technical analysis.
BTC/USD Weekly Chart
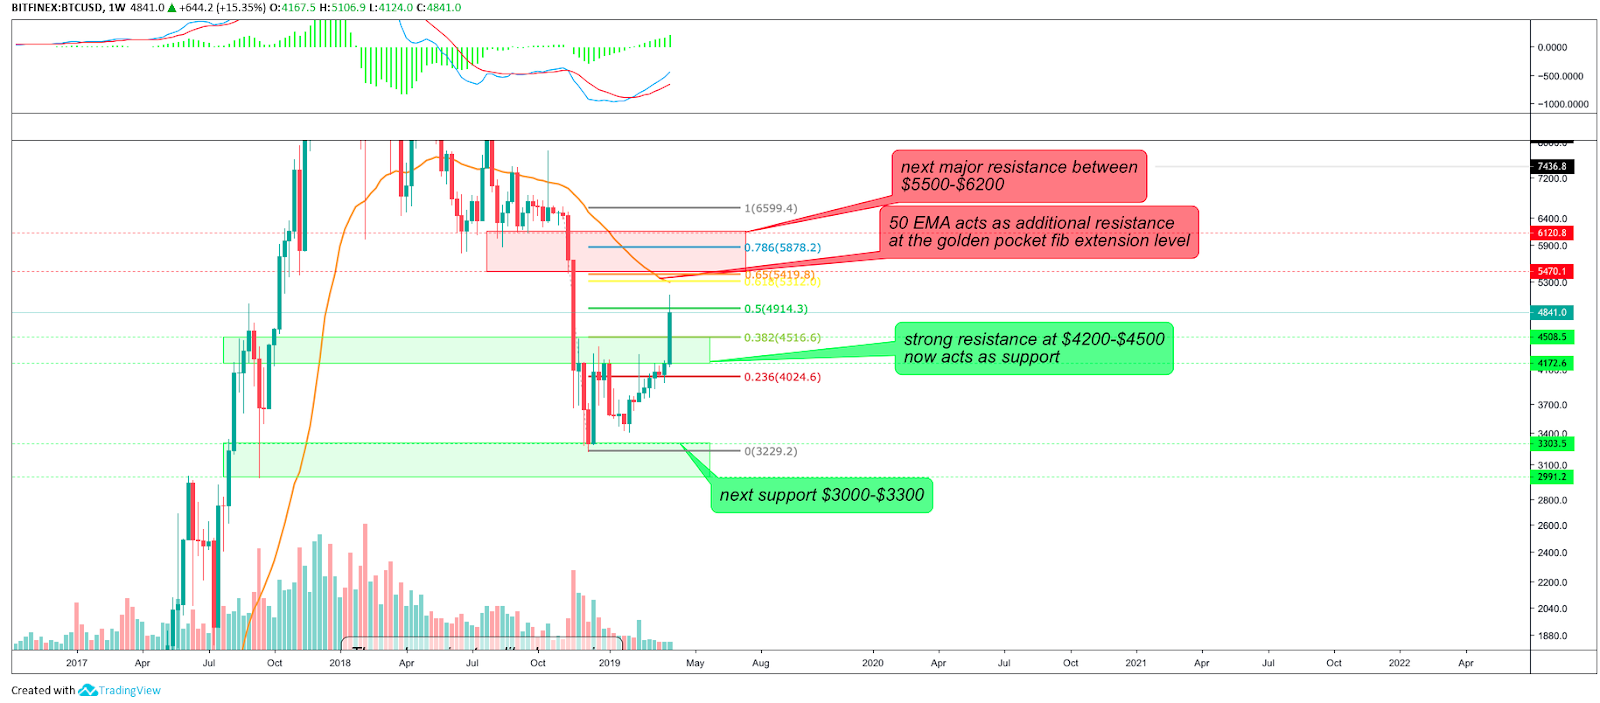
Bitcoin broke the resistance between $4200-$4500, which now acts as support. Additionally, the 0382 Fibonacci extension level is exactly at the upper part of the former resistance at $4516, which acts as additional support. With this bullish breakout, the gates are open to $5400, where Bitcoin faces multiple resistances. The 50-week-EMA acts as resistance slightly below the major resistance between $5500 and $6200. Additionally, the golden pocket of the fib extension level is located at the exact same spot, making a potential short-term price reversal at this point even more likely.
Thus, Bitcoin will most likely surge to $5400 before seeing a major correction.
Since the re-test of the major $6000 level is overdue, Bitcoin could find short-term support at $4500 before heading towards the $6000 mark.
ETH/USD Weekly Chart
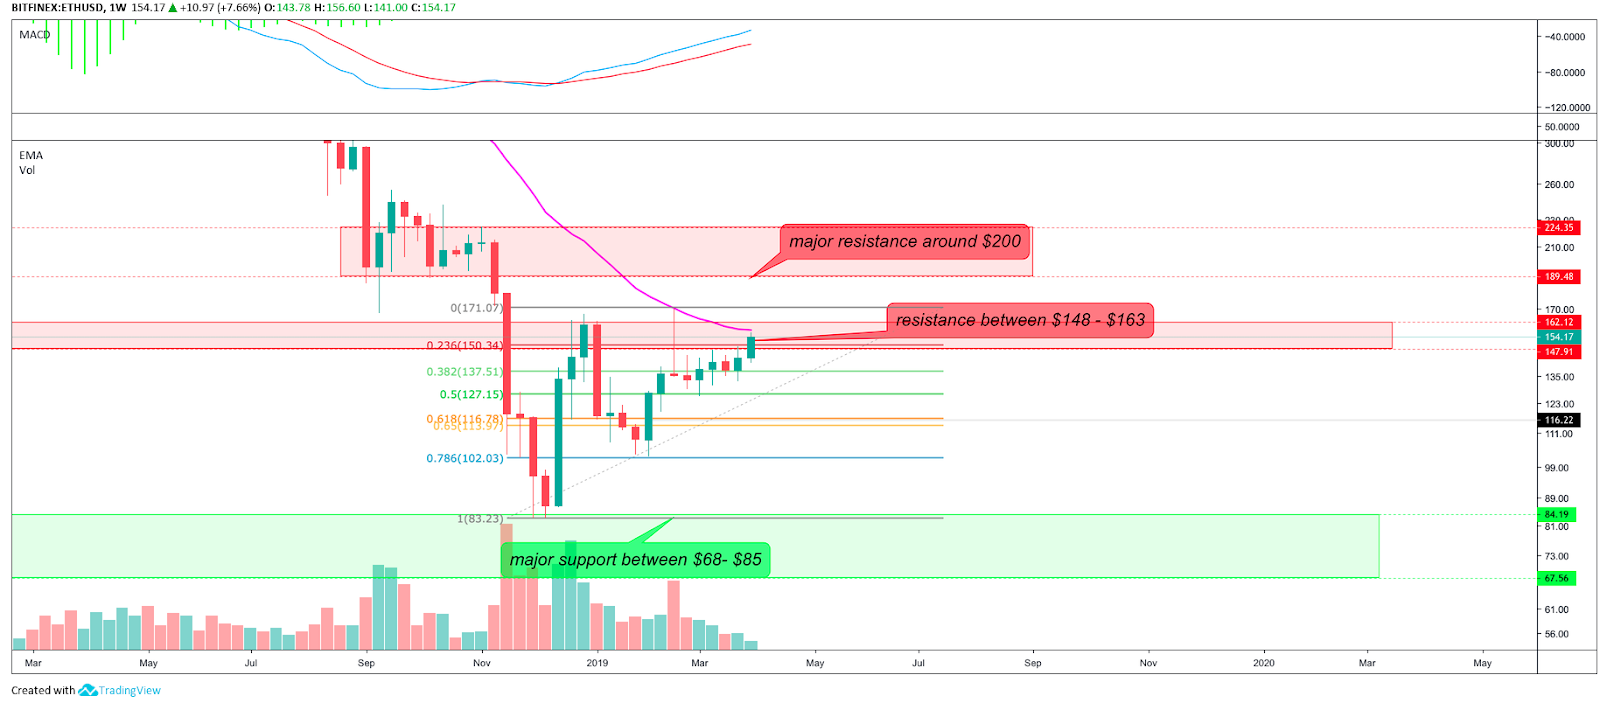
Ethereum is exactly in the middle of the major resistance between $148 and $163 and was rejected by the 21-week-EMA so far. With the weekly MACD being bullish since mid-December 2018, we can expect a continuation of the uptrend and a trend following of Bitcoin. This could even exceed the $163 resistance level and re-test the $200 mark.
APL/USD Daily Chart
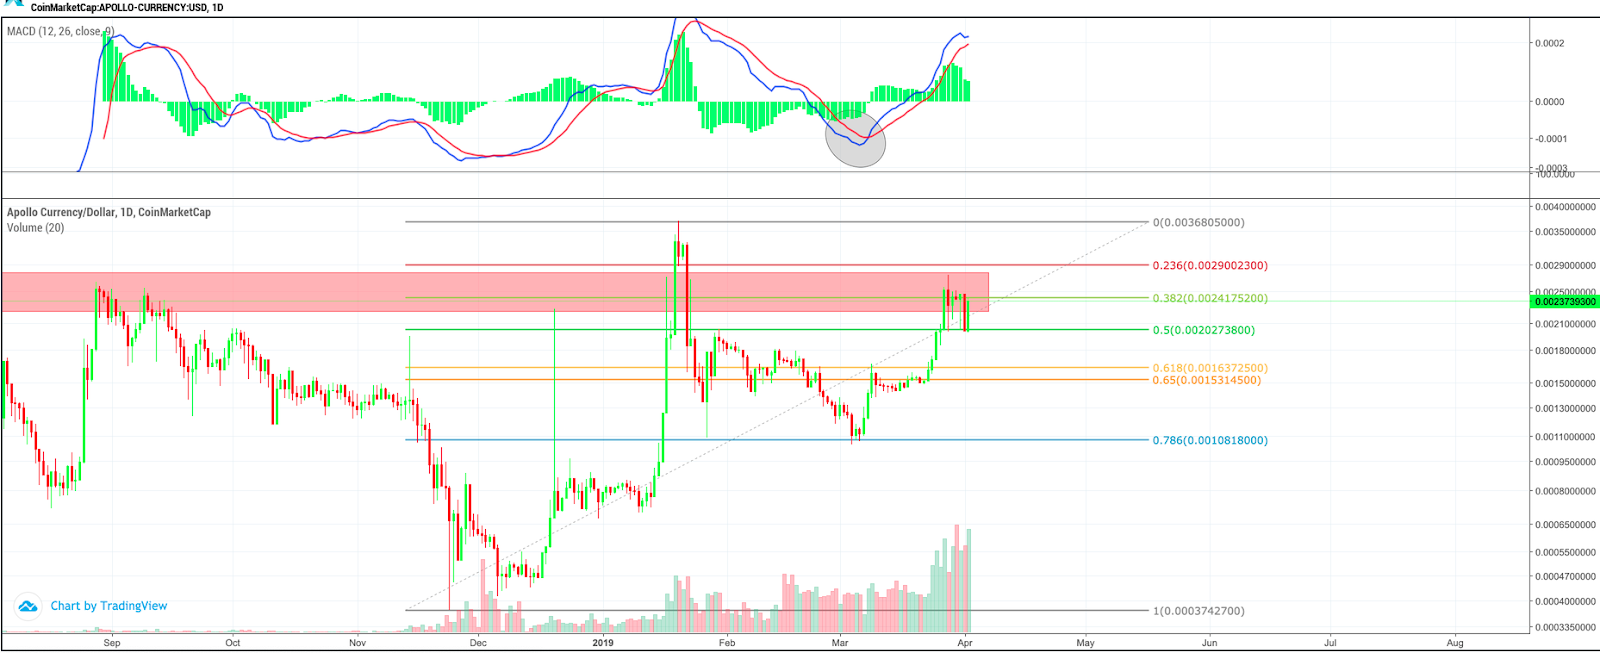
Apollo currency is in a massive bull trend since December 2018 and surged by nearly 800 percent since then. It is currently at a very important key level and faces rejection up to $0.0028. Once broken, Apollo could see a re-test of the all-time-high from late January, reaching as high as $0.00366. The MACD remains bullish and the 0.5 fib level held successfully as support so far. Interestingly enough, the volume is in a continuous uptrend, which can be considered very bullish.
It is noteworthy to mention that Apollo Currency is among the first cryptocurrencies to successfully implement sharding. Sharding is a technology that many blockchain projects have attempted to achieve but have been unsuccessful in achieving, thus, sharding has remained somewhat of an enigma. Sharding allows the blockchain to be split into segments, which positively affects the volume of the database of transactions, download speed, transaction speed and the stability of the system. Multilevel sharding allows the system to flexibly adjust the size of the block and the number of transactions in the database, all depending on the region, time and other parameters. Sharding also allows transactions to be divided into parts, this permits each node in the network to process only the components of a block, not the entire block itself. This division allows the system to process transactions faster and facilitates long-term sustainability for the Apollo network. The Apollo team has made great strides in the development of a real-world solution involving sharding and incorporated it on its blockchain first of April 2019.


