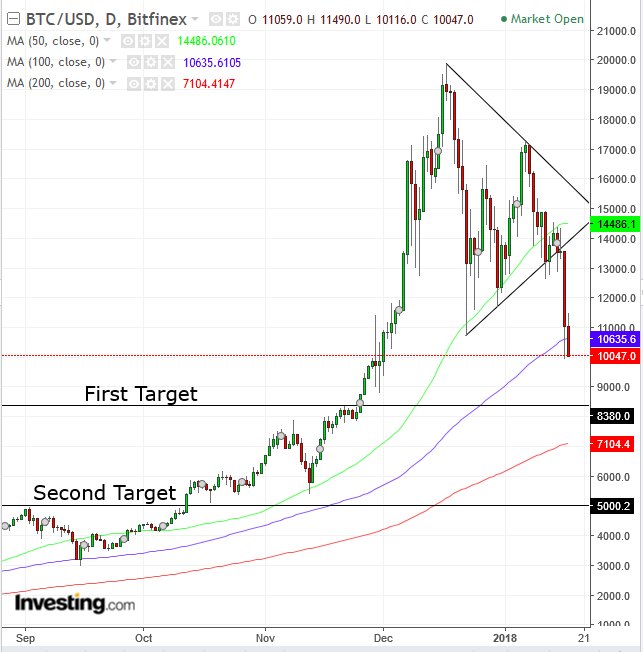
Growing concern of a concerted attack by regulators the world over to restrict the budding cryptocurrency industry has turned heads of institutional players and snapped the necks of retail traders. Naturally, the cryptocurrency that gained the most had the most to lose as bitcoin lost half its value in as little as a single month. On Wednesday just before the U.S. open, BTC dropped below $10,000 and was trading at $9,615.94.
On Tuesday alone, bitcoin lost more than a quarter of its value, falling almost 27 percent. The universally accepted gauge of a market reversal is 20 percent. In other words, a feat that takes bears weeks or months to achieve took a single day for the cryptocurrency king. That demonstrates how unmanageable and volatile this asset is. The question now is whether the king has been deposed or has merely executed a strategic retreat to return with more soldiers for a counter attack.
While we have been calling for a correction since May 23 – only to see a 10-fold rise in value – now that it has shed half of its worth, is it a good time to jump back in?
We don’t think so.
Yes, 50 percent is a solid correction and after an attempt to fall below the $10,000 key level on Tuesday, there were enough dip-buyers to push it to a close above that price point. Today, though, it continued to test $10k, but dipped below that round number just before trading opened in NY. After falling beneath the 50 dma (green), which was “guarding” the triangle bottom, it crossed the 100 dma (blue), at $10,636.

However, we consider these details minutiae, eyeing the biggest signal of all flashing in red. Tuesday’s low (which BTC is currently testing) has already registered a new trough that is lower than the December 22, $10,718 low, completing the minimum 2 peaks and troughs in the same direction for a trend. In other words, the falling peak-trough sequence began a downtrend for the first time ever.
Per the principles of technical analysis, based on a century of experience, in a downtrend, rallies are considered nothing more than corrections, while declines are accepted as the true, reliable price movements within the trend. In such an environment, cautious traders short the rallies while only aggressive ones buy the dips, knowing the risk of a sudden, sharp price about-face in resumption of the downtrend.
Short-Position Trading Strategies
- Conservative traders should wait for a return move to the downtrend line and evidence of its integrity with a down-day that covers the preceding up-day’s real body.
- Moderate traders can wait for a correction to the downtrend line but not necessarily for a confirmation of its integrity.
- Aggressive traders could wait for a correction, not necessarily to the downtrend line, which would be followed by at least one down-day covering the preceding up-day’s real body. Since the price of the asset is high and the swings are wild, we would caution against shorting prior to a return move, as a stop-loss from this point would be costly.
Targets
-
$8,400, November peak resistance
-
$5,000, key-level support above the implied target based on the height of the now-obvious bearish Symmetrical Triangle
