This looks like another terrifying week Bitcoin investors will have to suffer through. The price of the biggest cryptocurrency has been in a tailspin in the last couple of days. After the bulls could not breach the resistance of $11 780 on Monday, a sharp selloff dragged BTC/USD to as low as $9 450 by Wednesday. On Bitfinex, the price even fell to the $9 400 mark.
But why? According to the media, the SEC is the villain crypto investors have to blame. The Securities and Exchange Commission issued a statement on Wednesday, saying that digital assets are securities, which means all trading platforms offering virtual currency trading should be registered and regulated.
In addition, a Japanese attorney Nobuaki Kobayashi, who is also a trustee in the Mt Gox bankruptcy case, said he has sold up to $400 million worth of Bitcoin and Bitcoin Cash since September 2017, and plans to sell more.
So, “HODLers” not only have someone to blame for this week’s crash, but they could actually choose who to point their fingers at. But are such accusations justified? After all, no-one will deny the crypto world is still full of shady projects, to use a mild word. Almost half of last year’s ICOs have already failed and vanished, losing or stealing millions of dollars. Many analysts and crypto enthusiast have expressed an opinion that the crypto community would be much safer and trustworthy if there was a watchdog to make sure everyone plays by the rules. It looks like the SEC is the crypto world’s savior, not its destroyer.
What about Nobuaki Kobayashi? The man said he has been selling BTC and BCH since September. Obviously, he is not the “whale”, who took the market down with him, because the price of Bitcoin actually climbed from roughly $3000 to nearly $20 000 between September and December, 2017. That is a 560% gain while a whale is selling. Sounds more like a small fish.
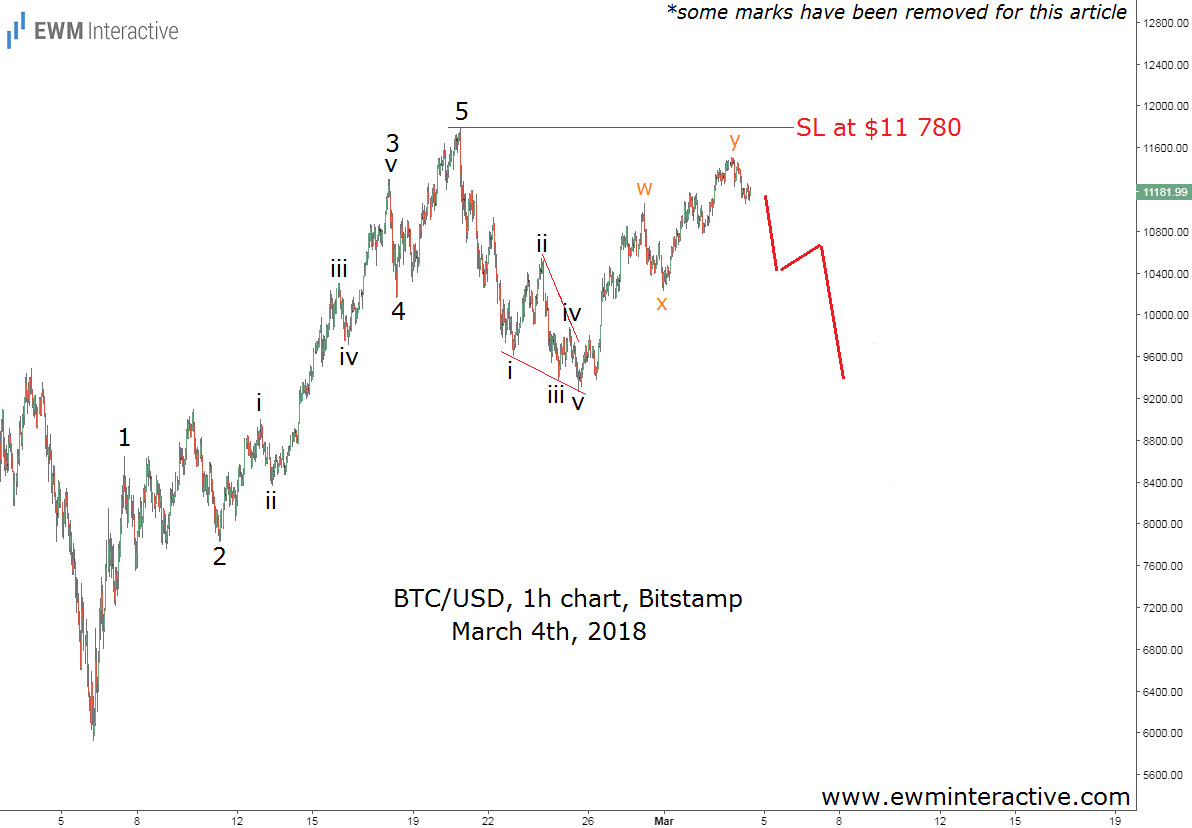
If it is not the big bad SEC nor Kobayashi, what happened? What really happened? Well, the Elliott Wave Principle happened. The chart below, sent to subscribers on Sunday, March 4th, shows that Bitcoin’s plunge is quite natural and has been expected three days ahead of the SEC’s crackdown on crypto exchanges.

The hourly price chart of Bitcoin allowed us to recognize the impulsive structure of the recovery from $5920 to $11 780. According to the theory, a three-wave correction follows every impulse. The first wave of the three-leg pullback was a leading diagonal down to $9260. The second was a double zig-zag recovery, labeled w-x-y, which had lifted BTC/USD up to $11 503 by the time of writing the analysis. Following the Wave principle’s logic, another selloff was supposed to begin as long as the pair was trading below the top of the impulsive sequence at $11 780. A stop-loss order at that level provided a very attractive risk/reward ratio. By the time we had to send the mid-week updates to subscribers, the hourly chart of Bitcoin looked like this:

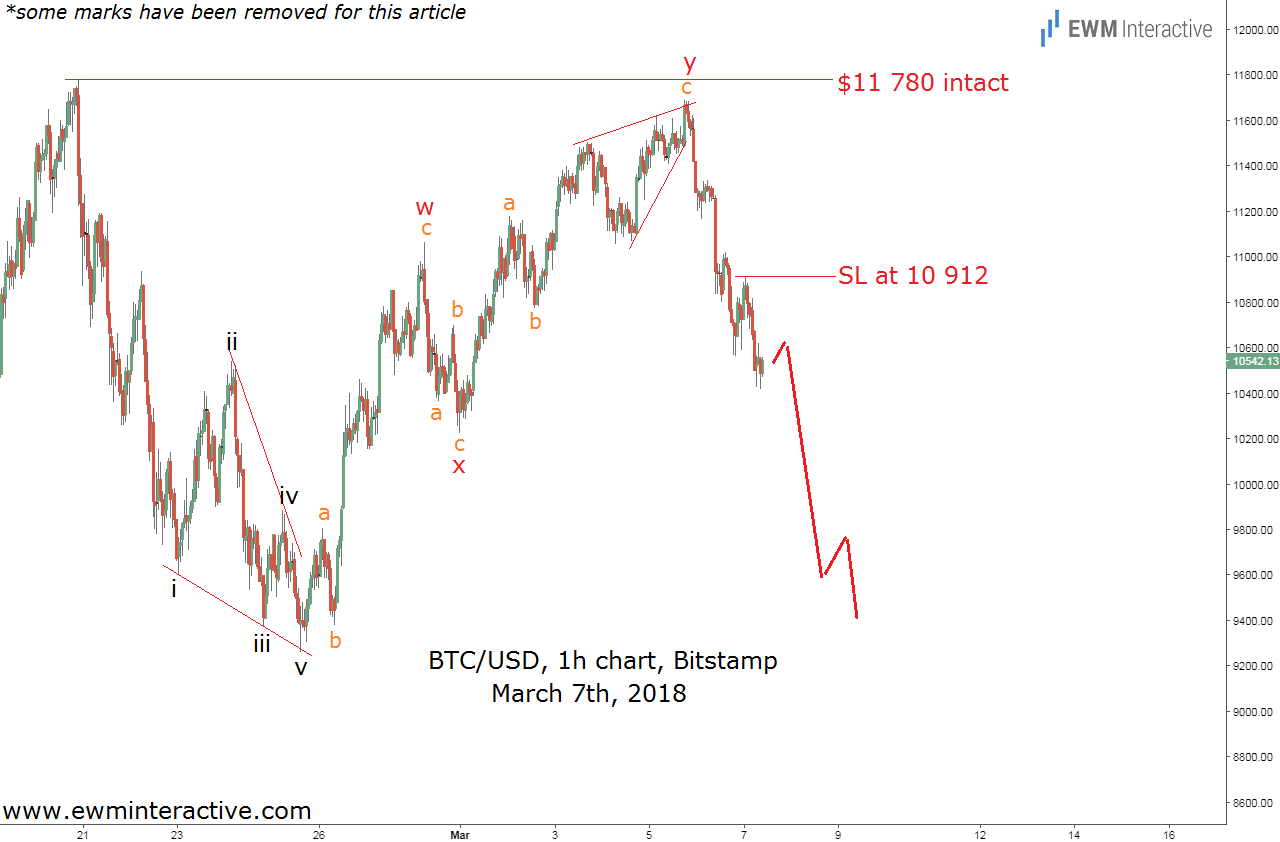
The bulls did all in their power to lift the price as high as possible, but they could not exceed $11 780, leaving the bearish outlook alive. By Wednesday morning, March 7th, Bitcoin prices were hovering around $10 540. This allowed us to lock in some profits by moving the stop-loss order down from $11 780 to the swing high of $10 912 and stay bearish. Several hours and one SEC announcement later, Bitcoin did this:

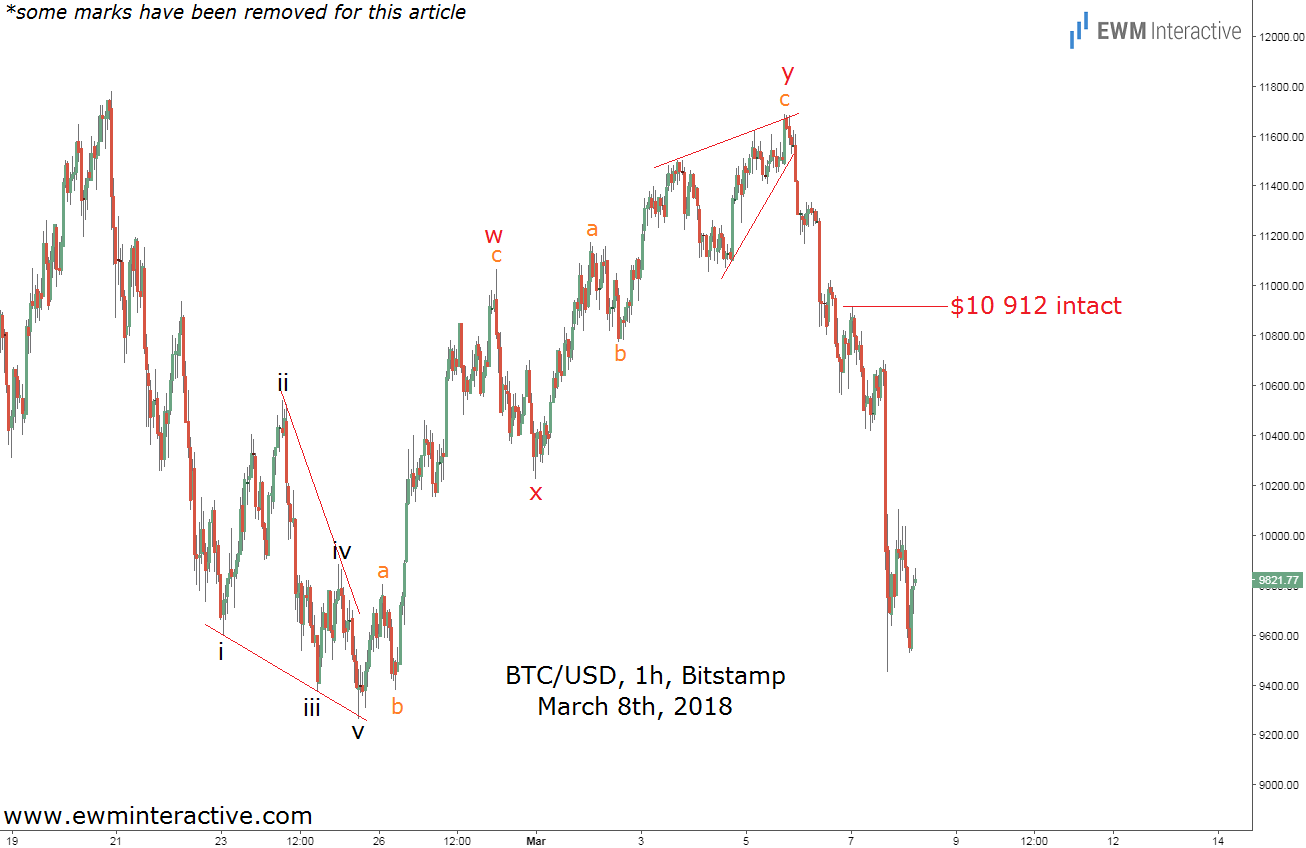
$10 912 remained intact, as well. The SEC’s bogeyman effect triggered the selloff Elliott Wave analysis has been preparing us for since Sunday. As visible, there is not need to look for someone to throw the blame on, because the market has been anticipating bad news. If it was not the SEC, it would be the whale sale. Or something else. The market was already tilted to the downside and has only been looking for an excuse to justify the expected decline. That is why we prefer looking at the price charts instead of relying on lagging external factors such as news and events.
