In my article from almost a month ago, I shared with you:
“In my humble opinion, odds are starting to increase a more significant low is forming for the Gray Scale Bitcoin Trust (OTC:GBTC) and also for Bitcoin (BitfinexUSD). As long as GBTC can stay above its 50-week Simple Moving Average, it has a good chance of moving higher. I do want to see GBTC move and close back above $12.39 to tell me the current down move has ended.”
Back then, GBTC was trading at $11. Fast forward, and GBTC is now trading at $14.40s – 31% gain. So, yes, it was a buy.
Then, in my article from two weeks ago, I concluded:
“… it is time to strap the bullish hat we were already wearing tighter. BTC could be in the starting gates of wave-3 of iii of 3. One of the most powerful moves. The money maker. If I am right, BTC should now be on its way to, ideally, $21,500-$23,500.”
Back then, BTC was trading at $10,900. Fast forward, and BTC is now trading at $12,800 – a 17% gain. So yes, I was right to strap my bullish hat on even tighter.
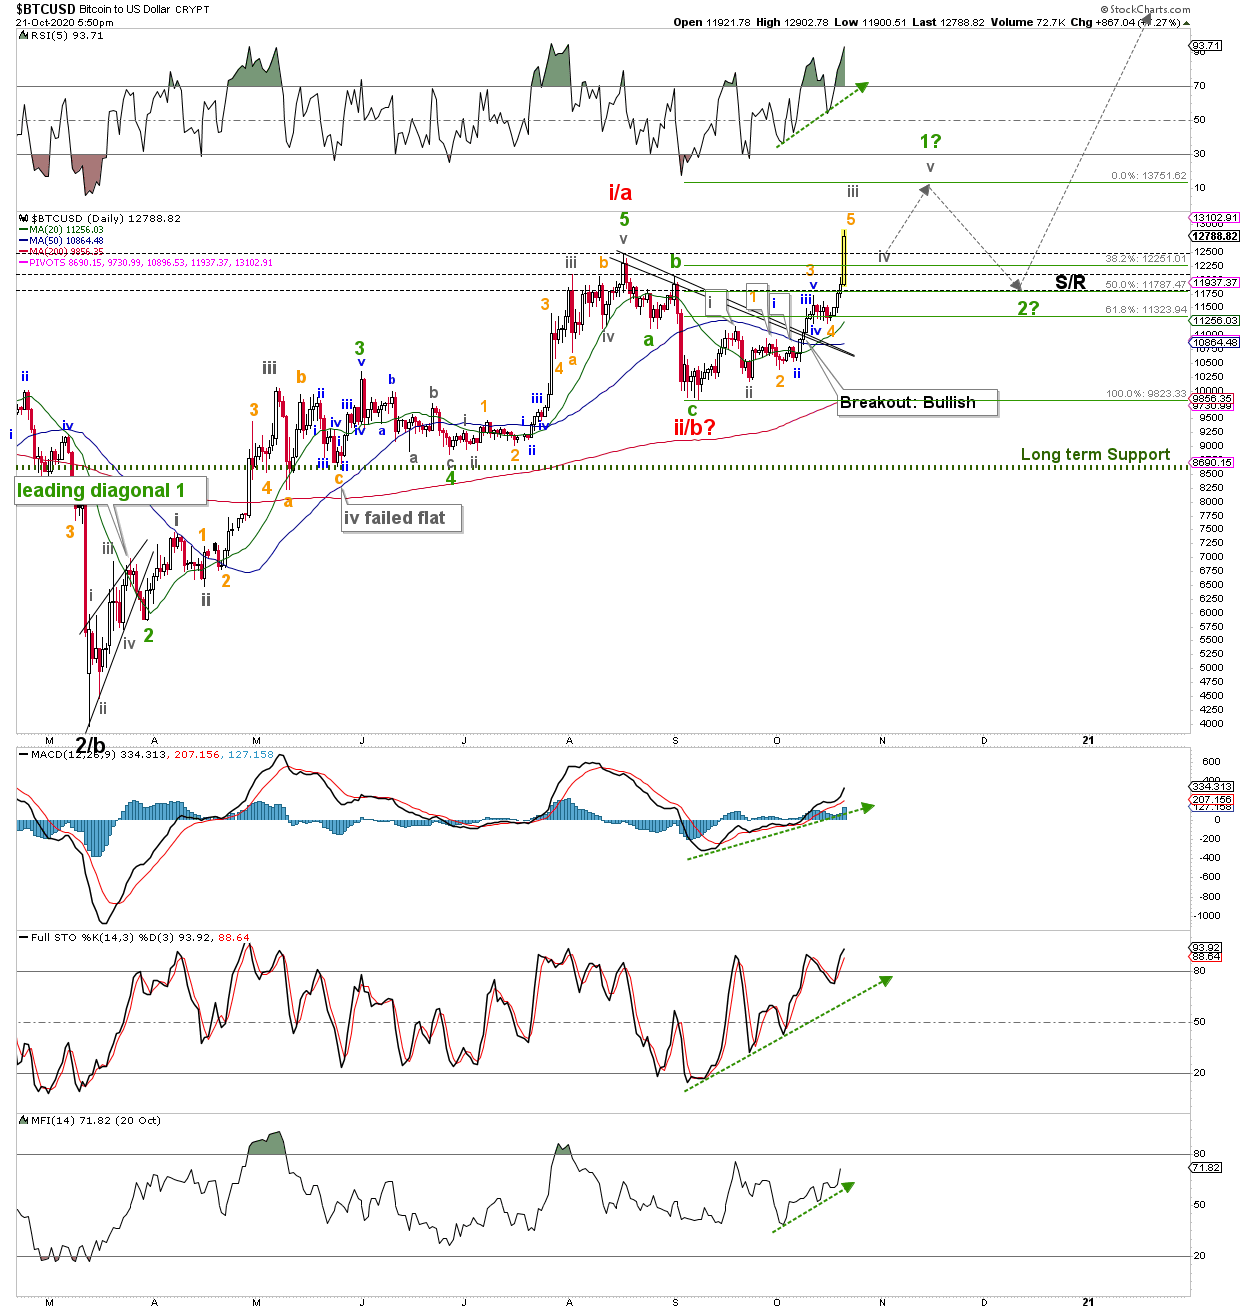
Figure 1.

On my private twitter trading feed, we’ve been successfully long GBTC since Sept. 30, and traded it several times. Our last entry is a long from $12.37. Meanwhile my Premium Bitcoin and GBTC Members have been taking advantage nicely from my daily updates, which kept them on the right side all this time. Today’s powerful move in BTC, and GBCT tells me it is subdividing higher, and needs to wrap up several 4th and 5th waves to complete green wave-1 to ideally around $13750 +/- 250. My original target for wave-1 was around $12350 +/- 150, thus any upside surprise is always welcome as it cements my bullish perspective I already have even further. Remember, in bull markets upside surprises and downside dissappoints.
Once green wave-1 completes, wave-2 should take hold and should bring BTC back to current support at around $12000 +/- 250 before–ideally–the third of a third wave kicks in rallying the instrument to $20,000 and beyond as long as the low made in September at around $9,800 is not broken. A first serious warning for the bullish case will be a break below last week’s low from current levels.
With the price above its rising 20-day Simple Moving Average (SMA), which is above the rising 50d SMA and, in turn, above the rising 200d SMA, this is a 100% bullish chart and thus a bullish Elliott Wave Principle perspective must be continuously preferred. Besides, all the technical indicators (RSI5, MACD, Stochastic Oscillator, and Money Flow Index) are all pointing up and are on a buy, supporting the notion for continued higher prices. Thus, I continue to look higher for BTC and GBTC until the market tells me otherwise. That is why I always have stops in place because I am wrong till proven right. And so far, the market has been proving my analyses right.
