Bitcoin seems to be approaching overbought territory as sell signals begin to pop up across multiple price charts.
Key Takeaways
- A massive influx of institutional capital into the cryptocurrency industry seems to be pushing Bitcoin's price up.
- Given the lack of resistance ahead, it is likely that BTC will revisit previous all-time highs.
- Nonetheless, historical price data shows that the flagship cryptocurrency may soon suffer a steep correction.
Bitcoin appears to have entered a new parabolic advancement. Its price has risen more than 80% since late September without any significant pullbacks.
However, a particular technical indicator estimates that steep correction is underway.
Strong Fundamentals Behind Bitcoin
Bitcoin’s uptrend seems to be fueled by a massive influx of institutional capital into the cryptocurrency industry. As uncertainty grows around the global financial system’s stability, large investors are flocking to the market.
Billionaires like Stanley Druckenmiller and Paul Tudor Jones, some of the most prominent, have written at length about the long-term impact that the massive quantitative easing programs implemented worldwide will have on the economy.
As central banks continue printing more money to avoid a financial downturn, investors are looking for an asset that serves as a hedge.
Bitcoin seems to be the answer.
BTC’s buying pressure is at record highs, which will likely lead to new all-time highs before the end of the year.
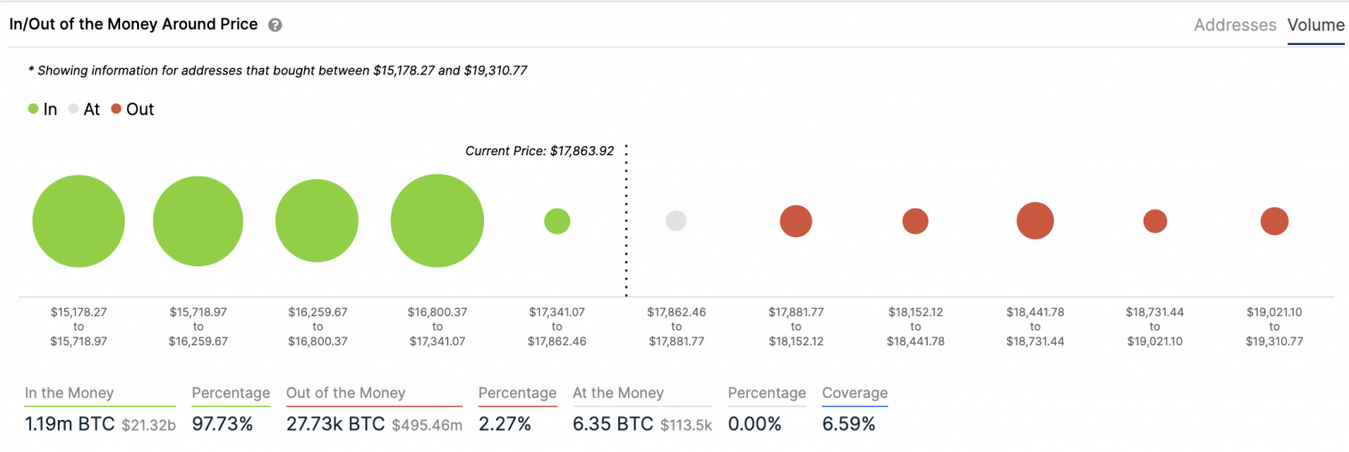
BTC’s recently established support base backs up this optimistic thesis. There is also little to no resistance ahead of it, based on IntoTheBlock’s “In/Out of the Money Around Price” model.
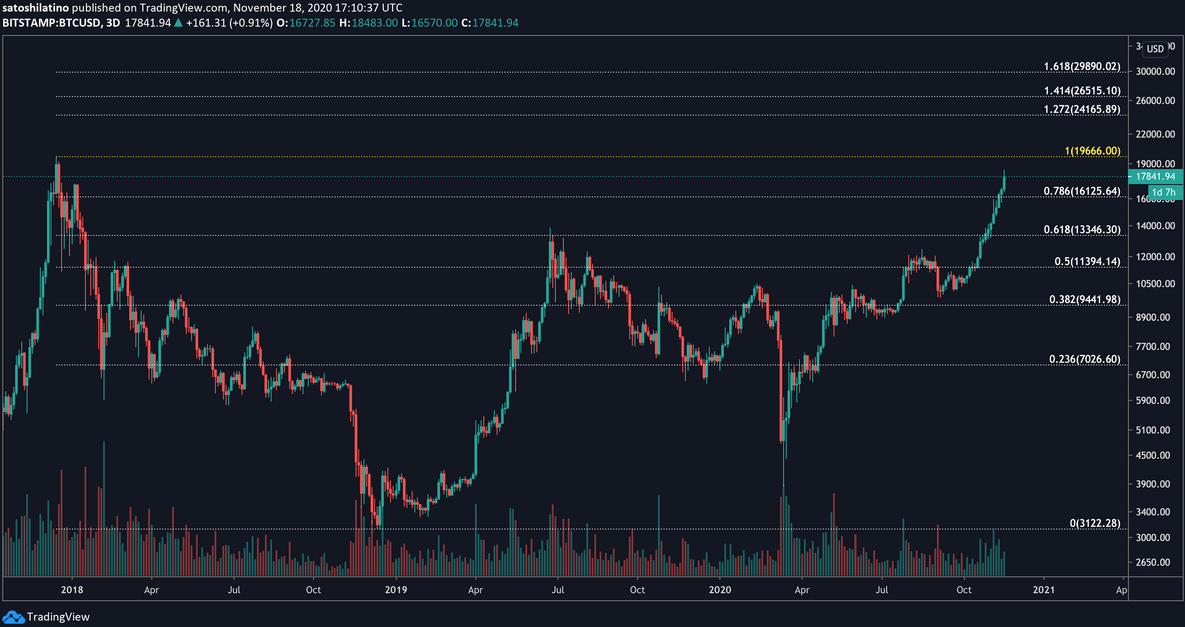
The Fibonacci retracement indicator shows many bullish targets will be met if the upward pressure continues. When measuring this technical index from the high on Dec. 17, 2017, of $19,700 to the low on Dec. 15, 2018, of $3,100, Bitcoin will indeed revisit previous all-time highs.
But if FOMO kicks in, the uptrend may be strong enough to push prices beyond the $19,700 resistance barrier. Moving past it will clear the path for a jump towards the 127.2% or 141.4% Fibonacci retracement levels.
These key potential targets sit at $24,170 and $26,500, respectively.
Regardless of the impressive bullish momentum behind Bitcoin, its price history suggests taking a note of caution.
Steep Correction on the Horizon
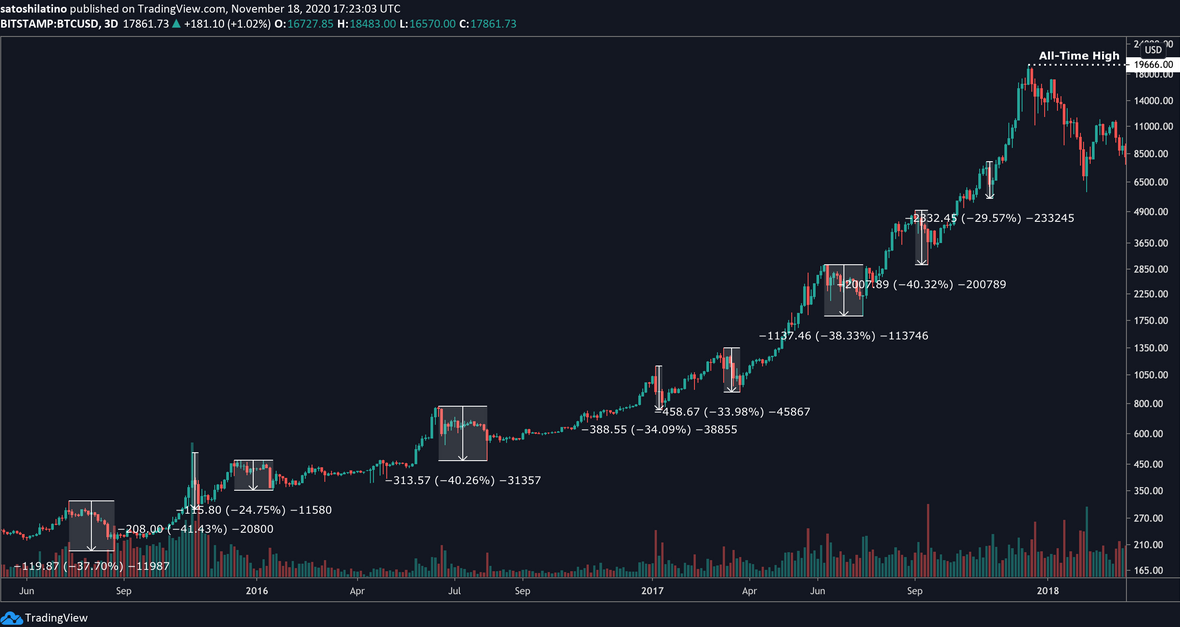
During the last bull run, 20% to 40% corrections were the norm. Each time Bitcoin rose to unexplored territory, a steep retracement followed.
Roughly nine significant pullbacks occurred between July 2015 and December 2017 that triggered mass liquidations across the board.
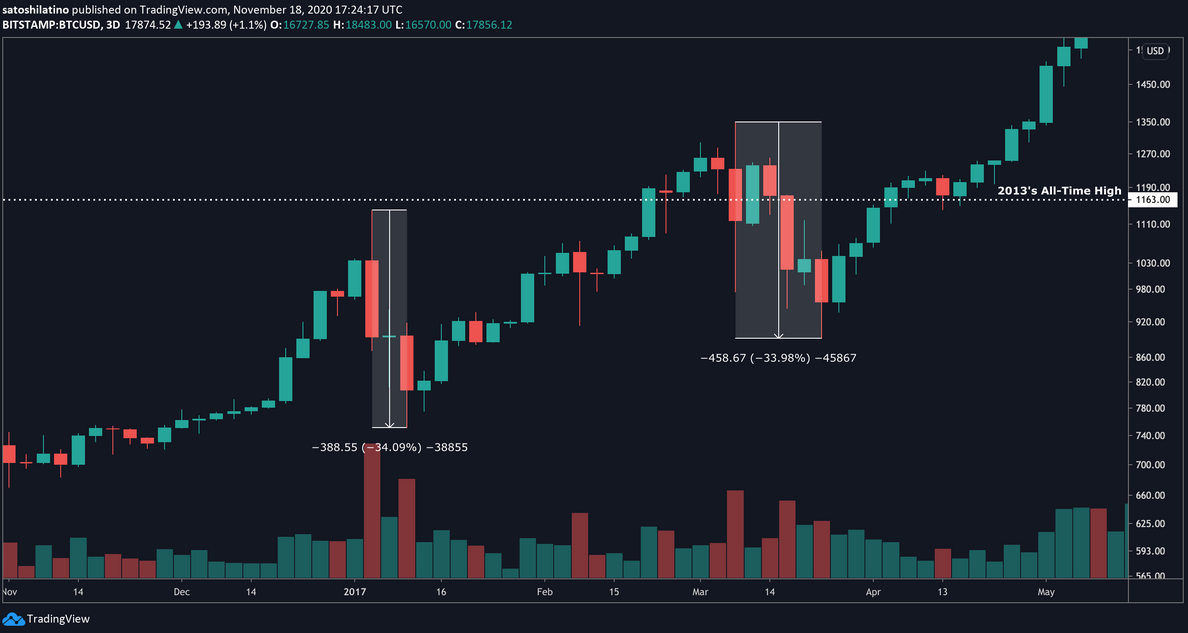
More importantly, when Bitcoin first tried to break above Nov. 30, 2013, an all-time high of $1,160, it was rejected, leading to a 34% retracement. It attempted to slice through this resistance barrier three months later, but prices pulled back another 30% after a few days.
It wasn’t until mid-April 2017 that BTC could turn this supply wall into support and rise to higher highs.
The TD sequential indicator is about to present sell signals in green nine candlesticks on the monthly and weekly charts.
These bearish formations suggest that Bitcoin could retrace for one to four candlesticks before resuming its uptrend.
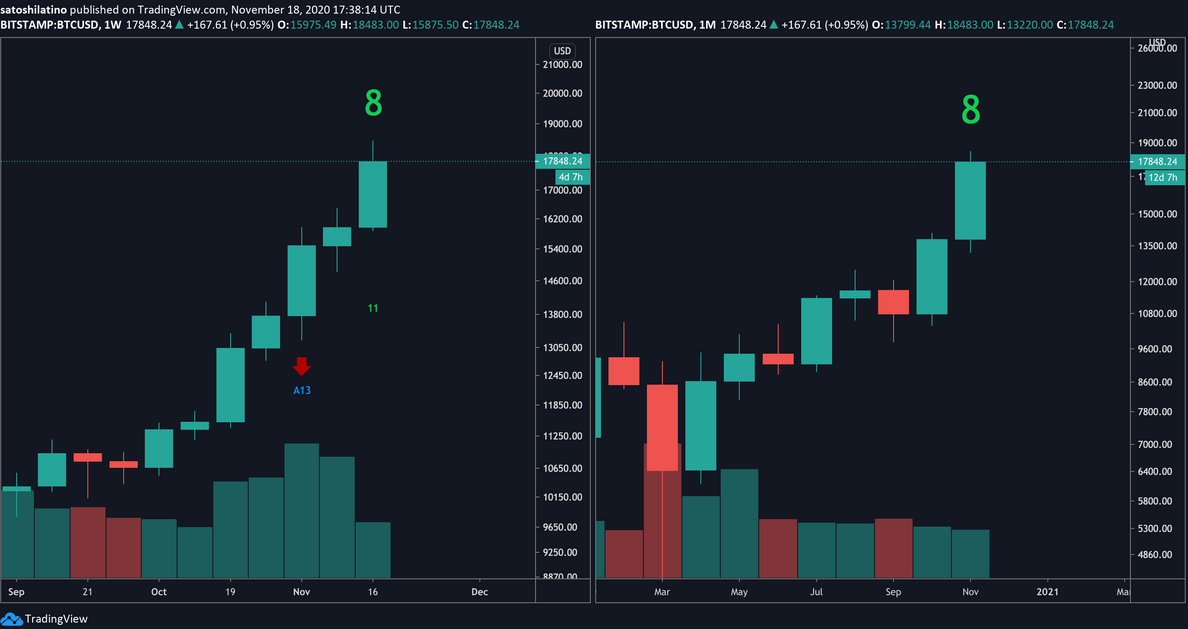
Given the timing in which these sell signals are developing, BTC might see similar price action in early 2017 when it tried to move past the 2013 all-time high.
For this reason, it is imperative to keep a robust risk management strategy to avoid getting caught in a steep retracement.
