Bitcoin activity has come to a short pause as traders await the results of one of history's most contentious U.S. Presidential elections.
Bitcoin is set for its most important trading week since May’s halving event, as crypto participants brace themselves for the uncertainty surrounding the upcoming U.S. election result.
Bitcoin Bulls Take Breather Before U.S. Elections
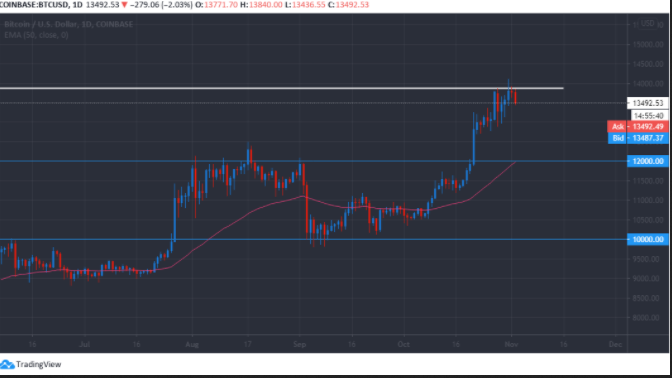
The pioneer cryptocurrency posted its second-highest monthly price close on record last month while setting a new multi-year trading high, above $14,000, over the weekend.
BTC has since retraced back below the psychological $14,000 figure, after buyers failed to breach January 2018 high, at $14,100.

Repeated failure to overcome the current yearly high further increases the possibility of short-term profit-taking and a subsequent price correction back towards the $13,000 support level ahead of the election result.
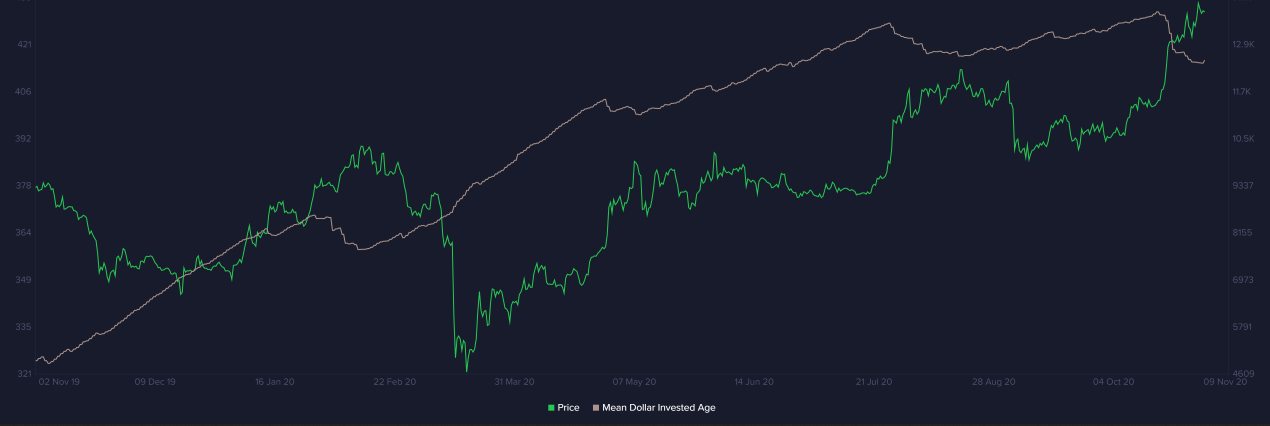
On-chain data analysis from the crypto behavioral platform Santiment continues to show several divergences, increasing the possibility of a meaningful near-term BTC price correction.
Bitcoin’s mean dollar value invested (MDVI) age helps identify bull and bear cycles. A steady rise in the MDVI index generally indicates healthy growth on the blockchain. In contrast, a drop in the index signals Bitcoin holders transferring coins to other addresses or selling BTC back to exchanges. This index has now begun to trend downwards for the first time in over three months, showing long-term traders liquidating their portfolios.
Periods during which long-term investors begin to take profits are often followed by short-term retracement or consolidation for days.

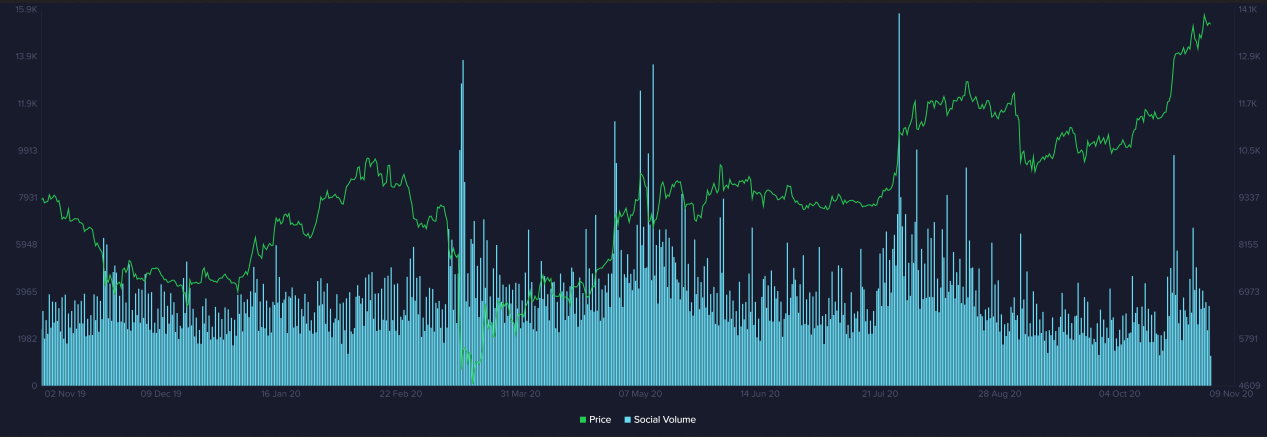
Sentiment metrics are also showing a notable divergence with price. On Oct.23, social volume on the platform spiked to over 9,000, marking a monthly top for BTC mentions.
This metric has since been on a gradual downtrend, while BTC’s price has been rising since Oct. 31. This downtrend may indicate a coming price correction, or it could mean that there is currently a lack of “new money” entering the network.
Usually, a spike in social volume is preceded by a local top, a change in price direction, or periods of consolidation; hence, we see a declining social volume from the chart below.

Looking at Bitcoin’s near-term technicals, a sustained decline below the $13,500 area could cause sellers to test to the important former swing lows around the $13,000 and $12,700 area.
If sellers can gain traction below the $12,700, then bears may target Bitcoin’s 50-day moving average, around the $12,000 level.
If bulls can breach the $14,100 resistance level, then a buying frenzy towards the $15,000 level may occur.
Once above the $15,000, the January 2018 trading high, at $16,275, offers the strongest form of technical resistance before the $17,230 level.
