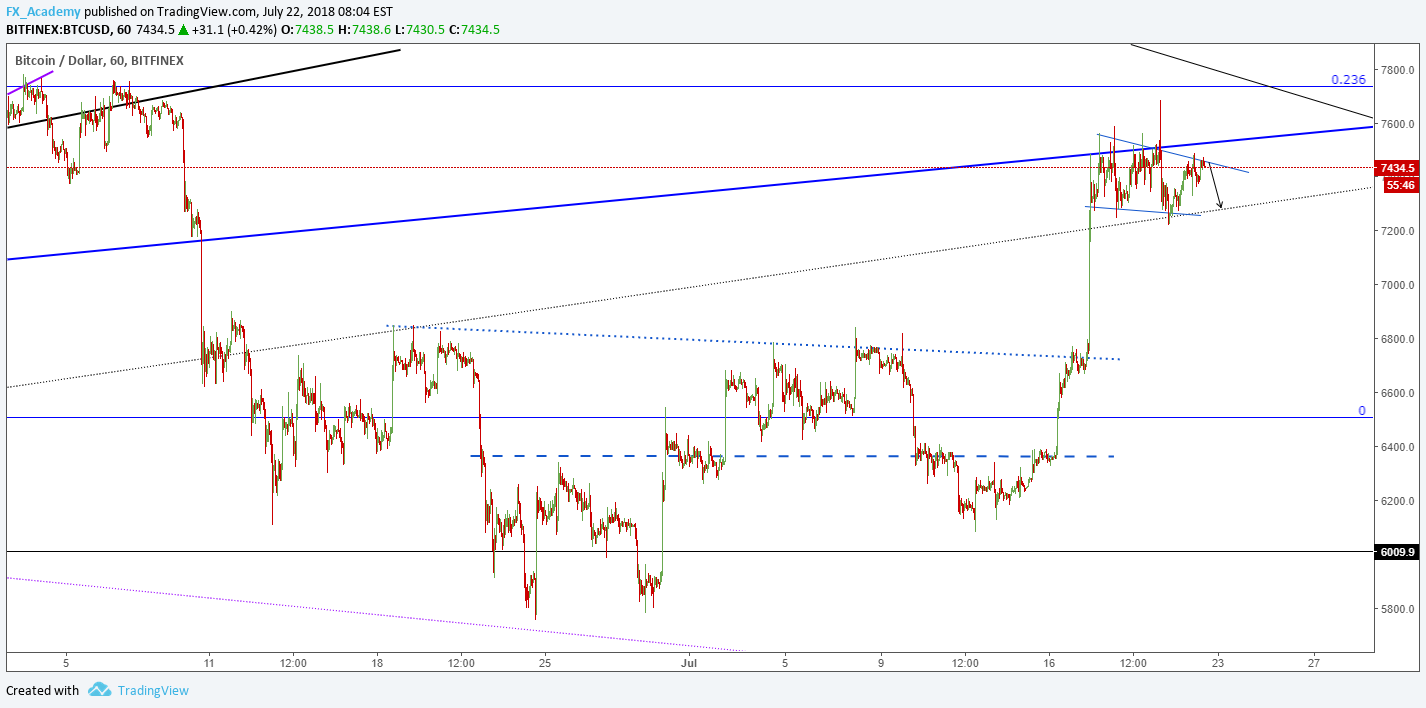
The price of Bitcoin is in a descending channel since Tuesday's exponential increase which led the price of Bitcoin up to 7511$.

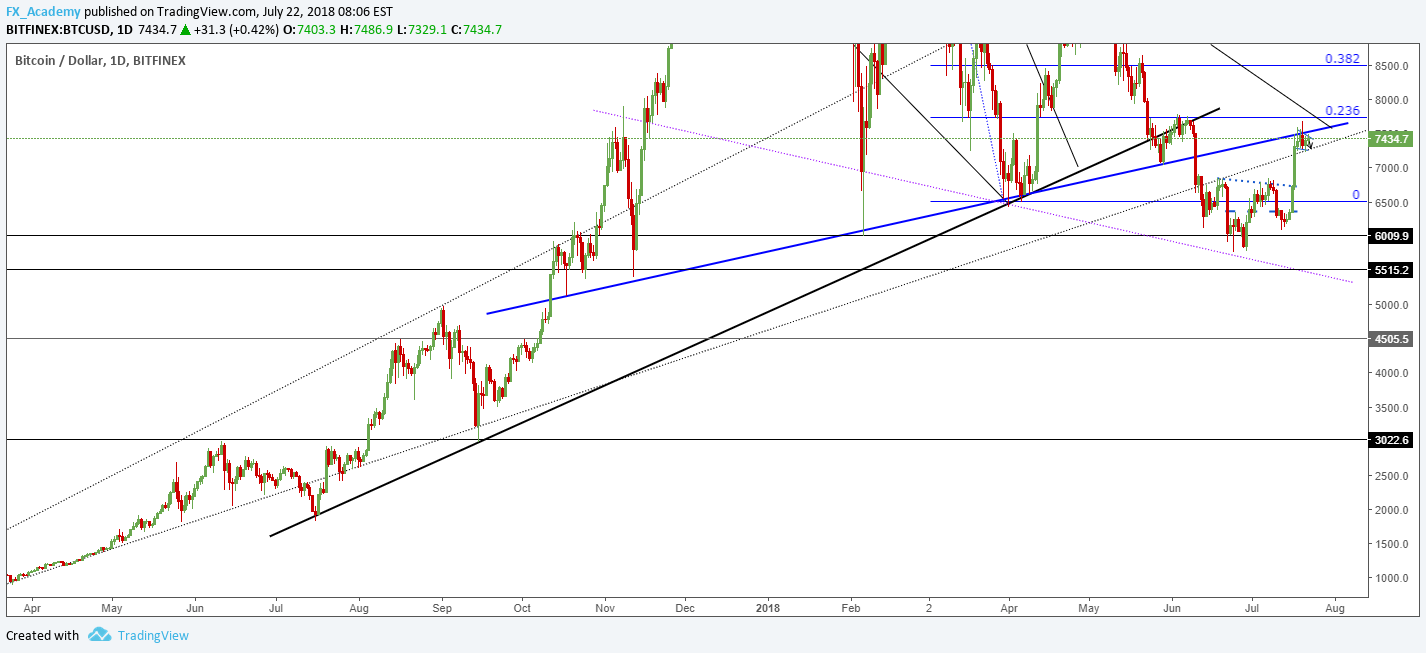
As the price is currently interacting with the channel's resistance and showing signs of weakness indicated by the wicks on the seller's side I am expecting it to go down from here to the baseline support 2 (dotted black line). This line is very interesting and I'll show you why on the daily chart on which it is drawn.

As you can see from the daily chart baseline support 1 is the bold black line, and baseline support 2 is the dotted black line. This line dates from 24.03.2017 when the uptrends first higher low was established.
That is why I am looking at this level as a key indicator or whether or not the uptrend is going to continue or are we in for another low. I am expecting a retracement back to that level which is in this case at 7287$ for a retest of support, and if that level serves a support uptrend continuation and a breakout from the descending channel on the upside. If not, I would be looking at another low to 5500$ or so.
