Bitcoin stole the crypto spotlight following an impressive bull rally that has seen it rise above $17,000.
Key Takeaways
- Bitcoin is up more than 26% over the past two weeks as upward pressure mounts.
- On-chain data reveals there are no resistance walls ahead to impede BTC from advancing further.
- However, the TD sequential indicator suggests that a short-term retracement may be in the works.
Bitcoin just broke above the $17,000 mark for the first time since early January 2018.
Though the flagship cryptocurrency is in a steep uptrend, technicals point to a small retracement before higher highs.
Bitcoin Reaches New Yearly Highs
The pioneer cryptocurrency seems unstoppable as the buying pressure behind it is skyrocketing to record highs. Whales continue to add more BTC to their enormous holdings, and prices have done nothing but rise over the past few weeks.
Bitcoin has surged nearly 26% since Nov. 3, and on-chain data suggests there is more room to go up.
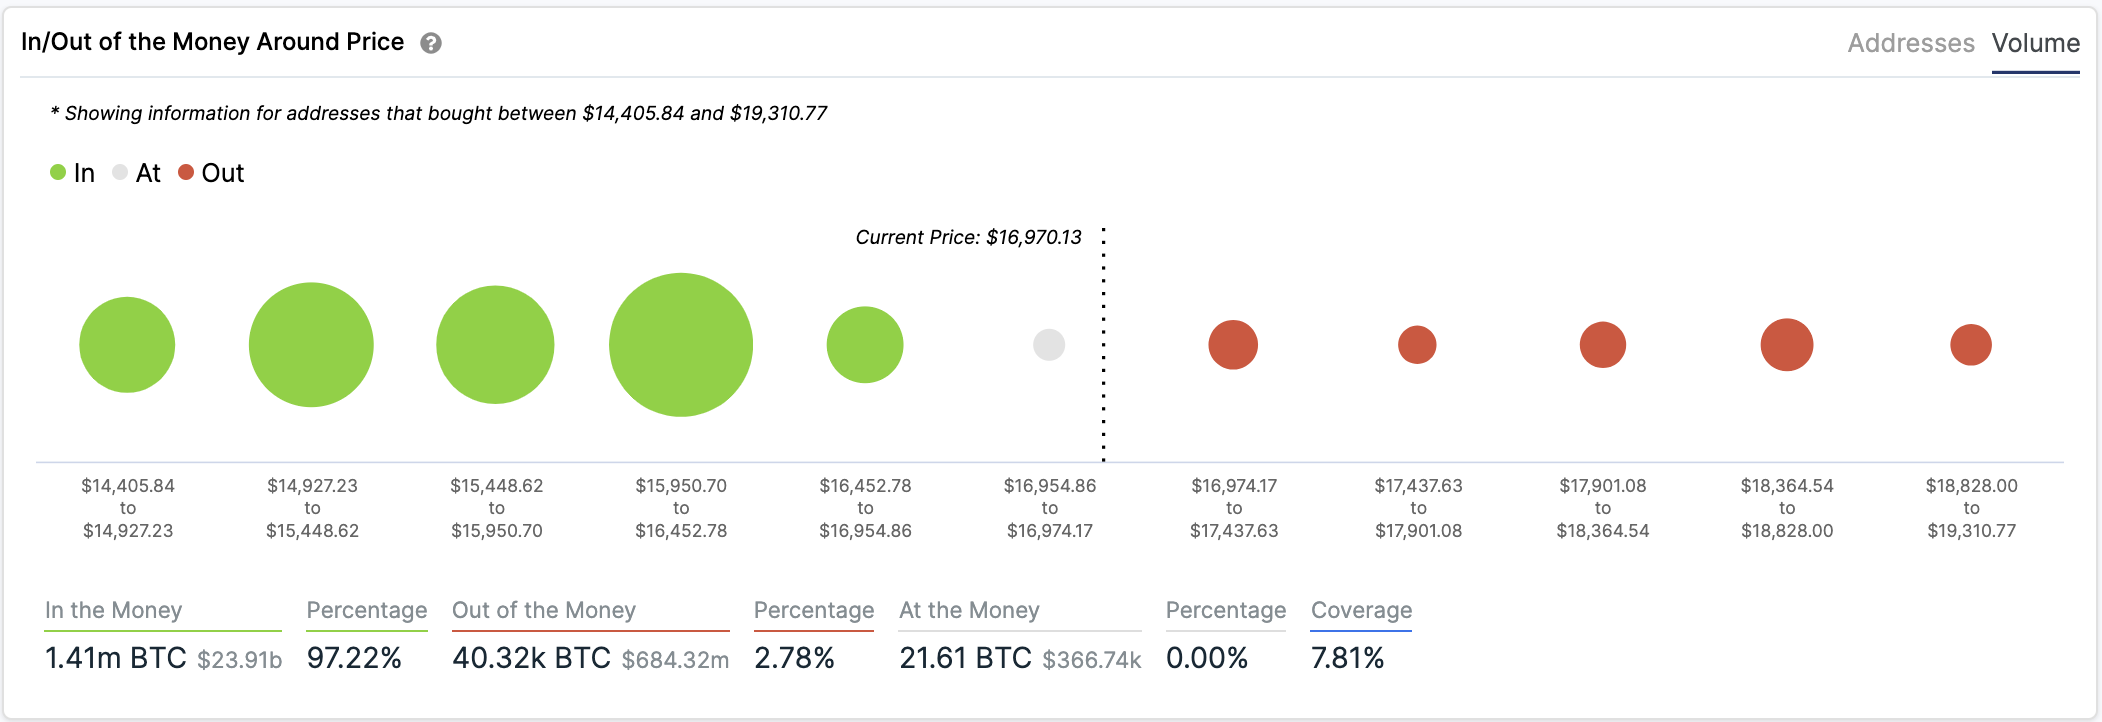
IntoTheBlock’s “In/Out of the Money Around Price” (IOMAP) model reveals that there aren’t any significant supply barriers that would prevent Bitcoin from advancing further. The only potential obstacle to overcome lies at $17,200, where over 34,000 addresses had previously purchased more than 11,000 BTC.
Slicing through this relatively weak resistance wall will lead to a swift jump towards $18,560.
After that, it’s a mere $150 before breaching new all-time highs.

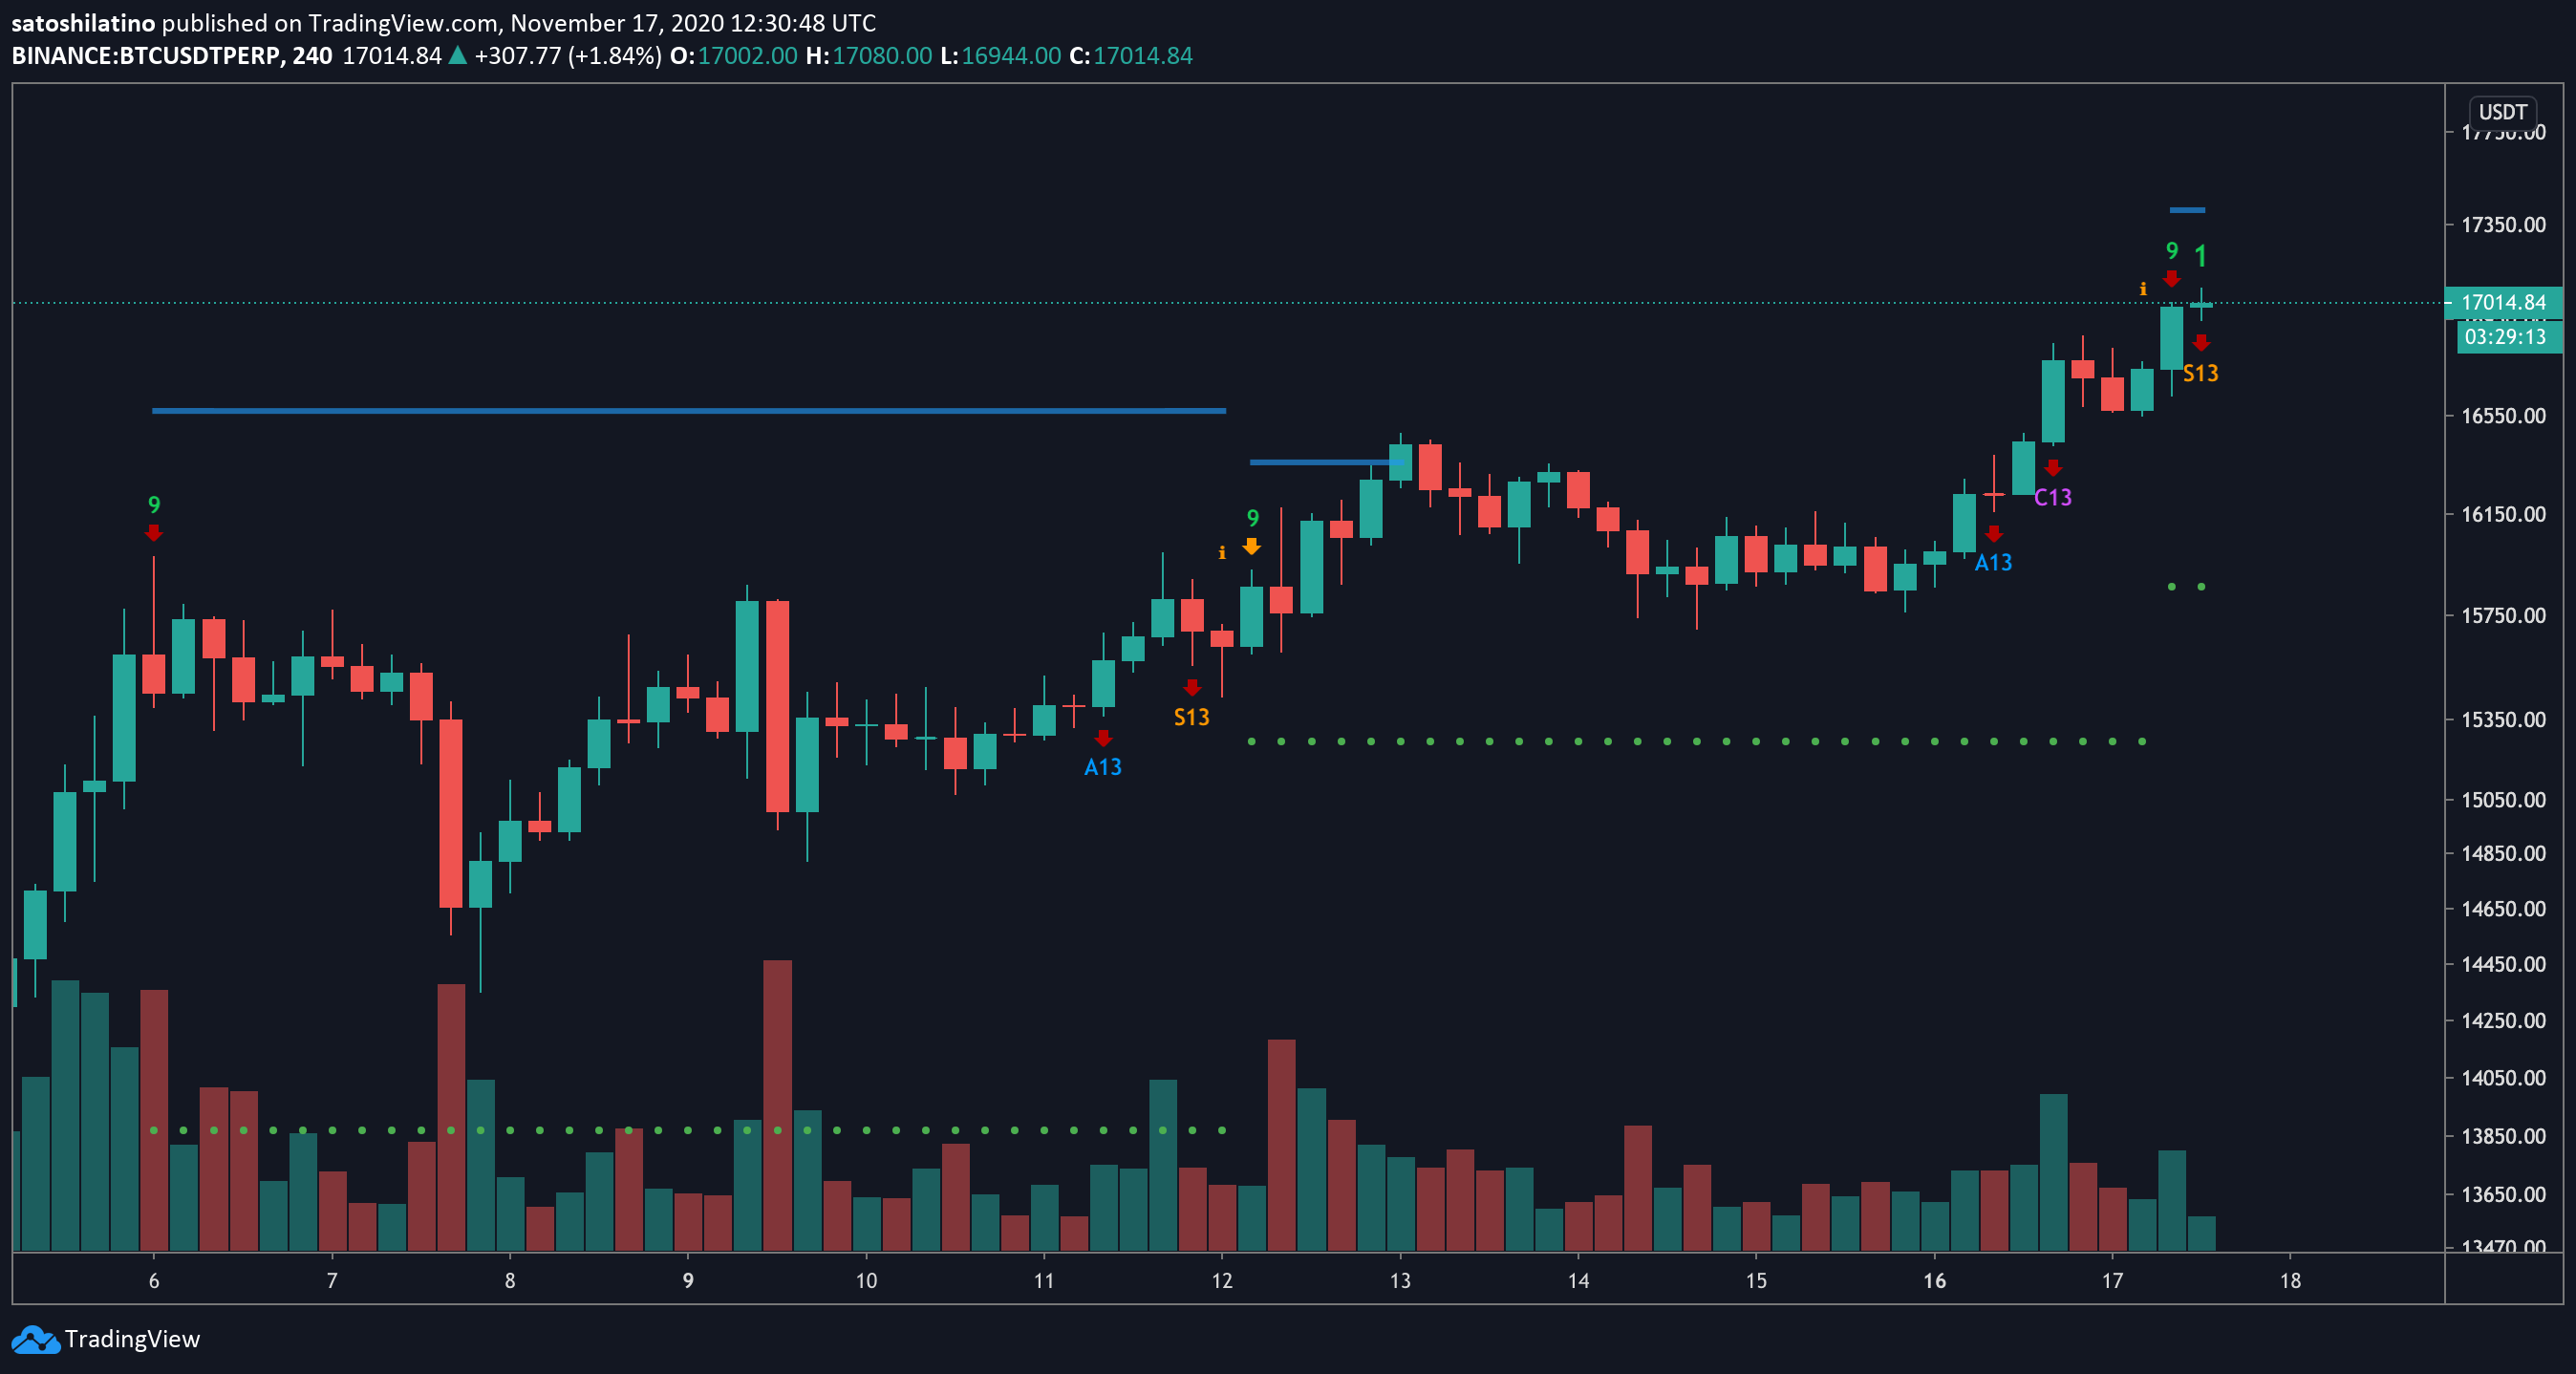
This technical index presented a sell signal in the form of a green nine candlestick on Bitcoin’s 4-hour chart.
The bearish formation anticipates that the uptrend may be approaching exhaustion, and prices could retrace for one to four 4-hour candlesticks.

In the event of a downward impulse, the IOMAP cohorts show that Bitcoin sits on top of stable support. Roughly 900,000 addresses have previously purchased nearly 500,000 BTC between $16,000 and $16,700.
Such a significant demand barrier may have the ability to absorb some of the selling pressure and allow prices to rebound.
