- Bitcoin continues trading sideways
- Meanwhile, Ethereum remains volatile
- Overall, bulls are very much alive for both cryptos
Bitcoin's attempts to break above $31,000 have been feeble in the past week. However, as the price dipped below $30,000, it became evident that there was still active demand in the lower ranges.
Ethereum encountered resistance at $1,900 last week and has now surpassed the critical resistance level, trading at $1,945 today thanks to buying seen in the latter half of last week.
Bitcoin Struggles Against April Highs
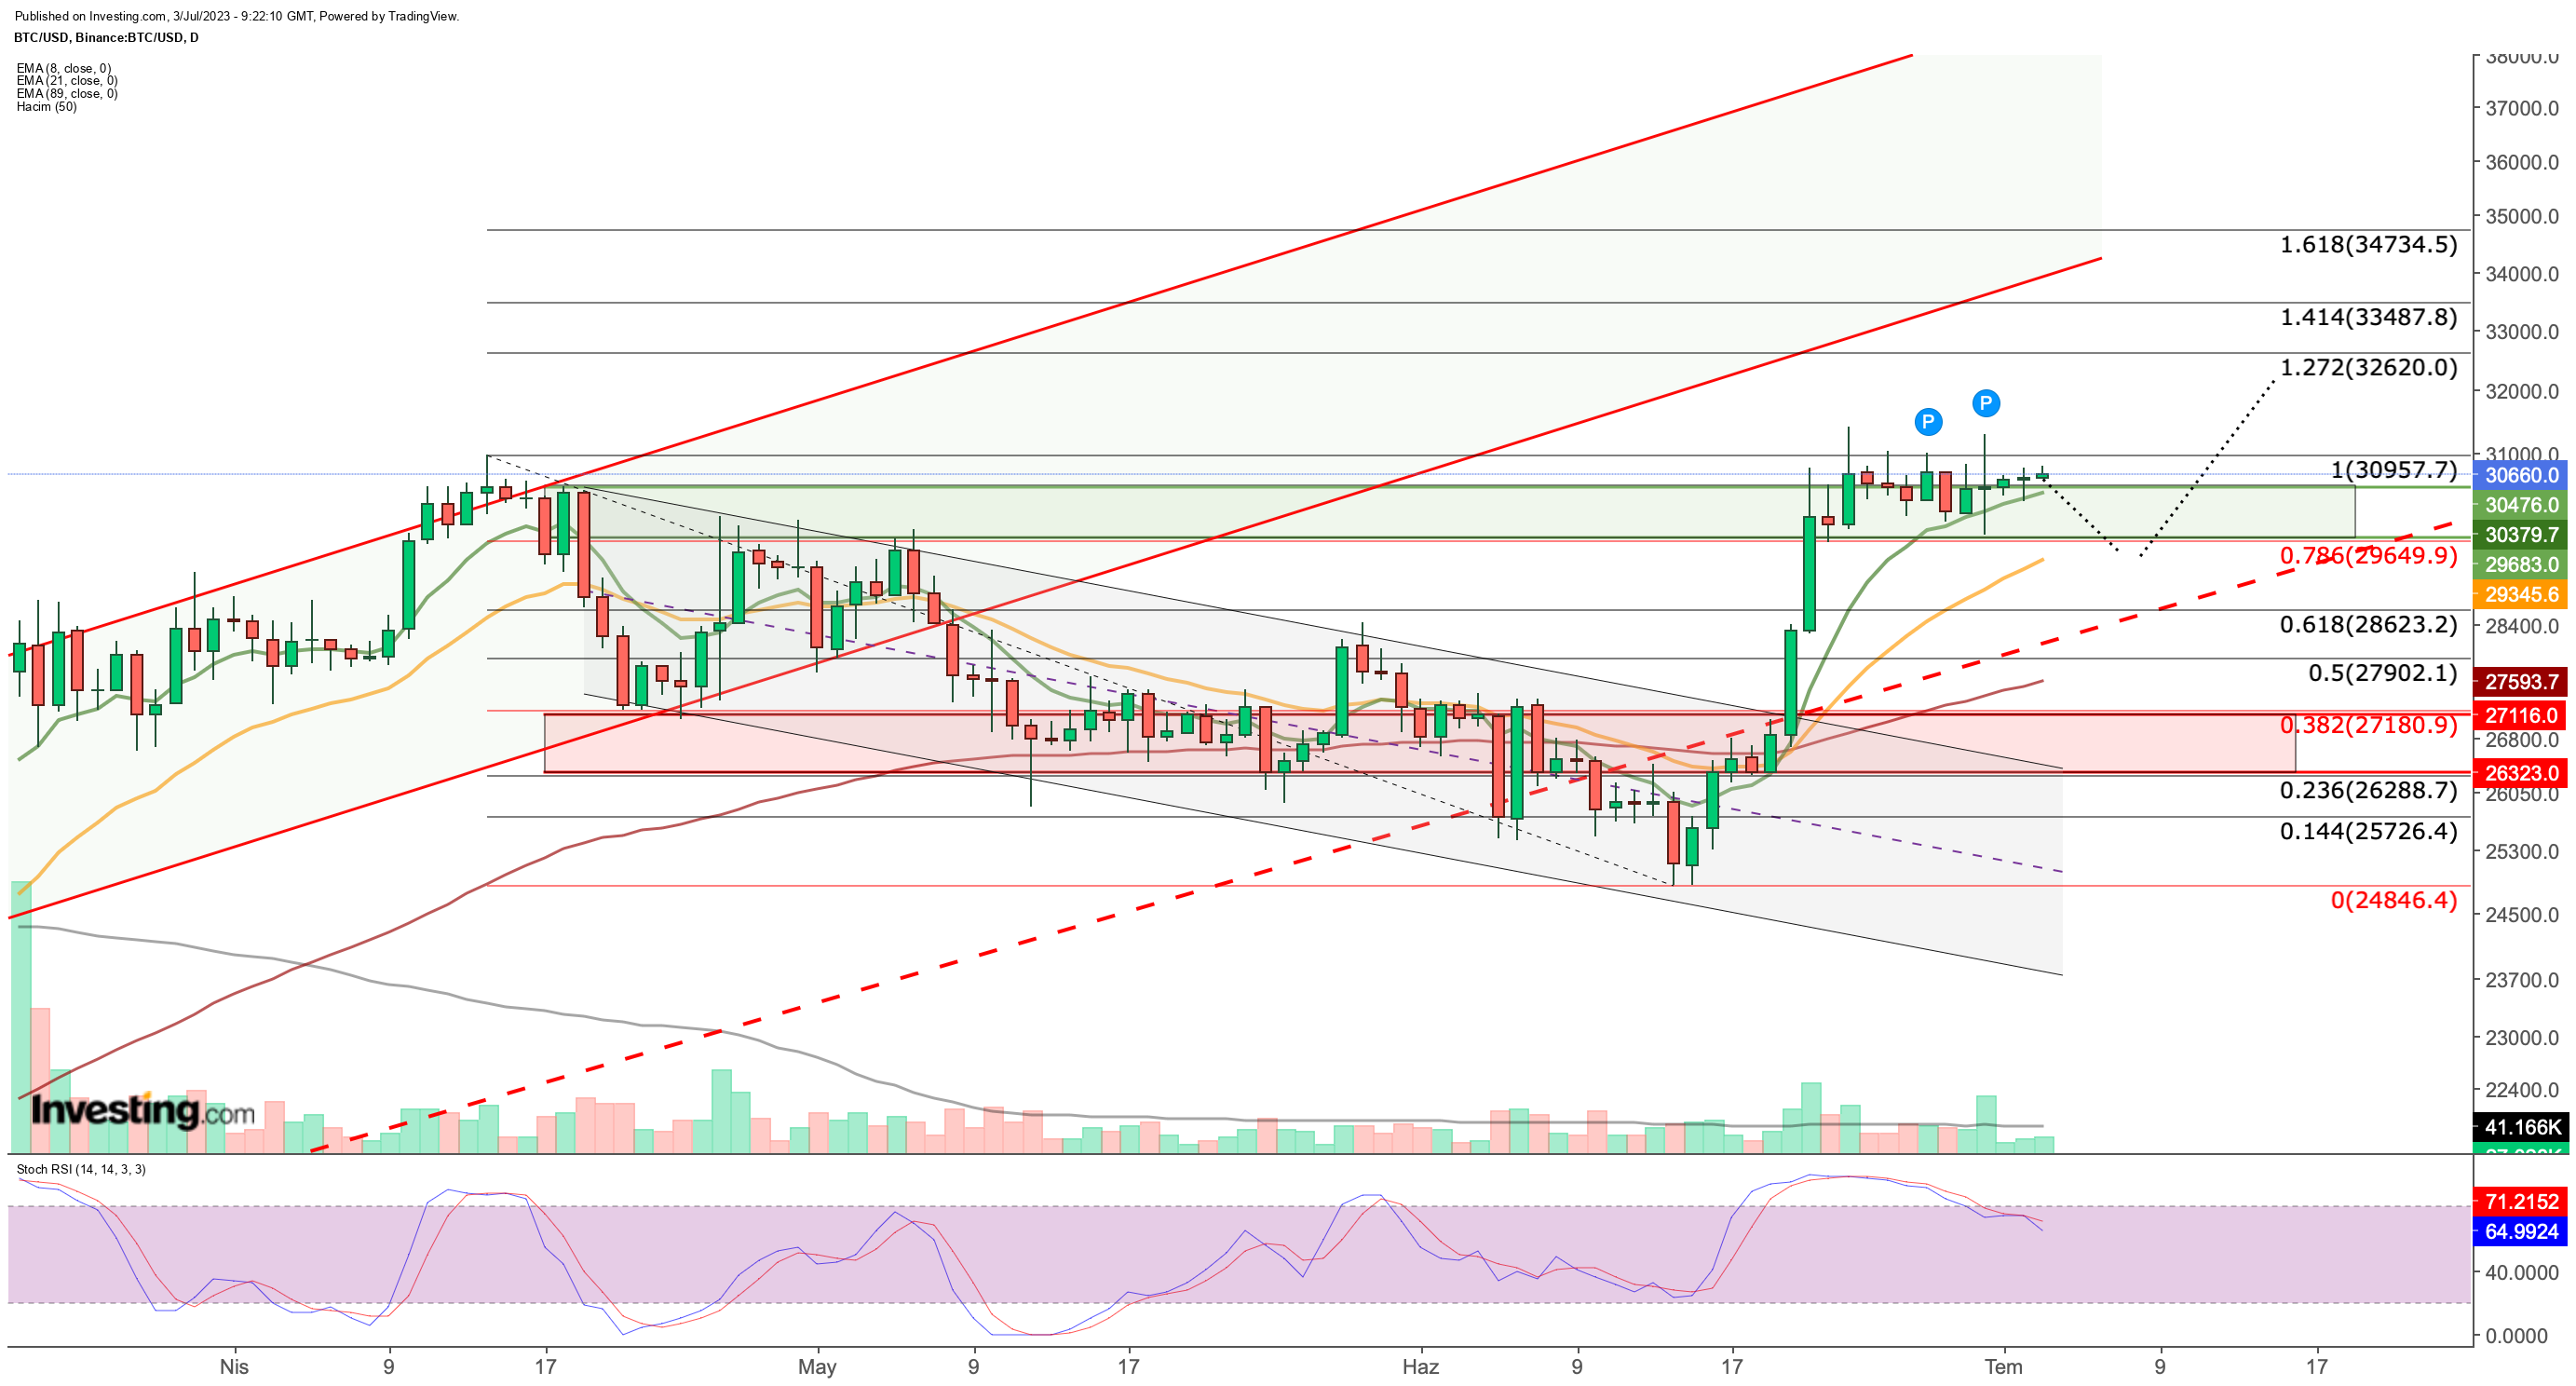
Bitcoin's struggle to surpass its April peak continues. Between June 15 and June 23, Bitcoin stabilized around the $30,000 range amidst rising demand. Since then, it has been moving sideways without much change.
The current price range has been a persistent resistance area since April. On Friday, news broke that the SEC deemed spot ETF applications inadequate and requested updates, causing temporary price fluctuations.
This news set a trading range for BTC, with the cryptocurrency reaching a high of $31,300 and dropping to a low of $29,700. Eventually, the cryptocurrency stabilized around the $30,500 mark.

Based on the current situation, if BTC fails to achieve a daily close above $31,000, it could trigger a wave of profit-taking and potentially lead to a correction this week. Additionally, Bitcoin's hourly closes below $30,400 might accelerate the correction phase, as it would fall below the 8-day EMA.
Regarding support levels, the $29,600 mark would be closely monitored as a second and more solid support zone for BTC. If the retracement continues, a drop to $28,600 is possible, which is an important level as it represents the lower band of the rising channel.
On the bullish side, entering the $31,000 region would be a significant move for the trend to continue. If this occurs, BTC may reach the target range of $32,000 to $34,000 during this week.
The recent consolidation in the price action over the past four days indicates an impending increase in volatility. Considering the Stochastic RSI on the daily chart dipping below 80 and the failure to surpass the resistance zone for ten days, downward pressure may be observed in the next move.
In such a scenario, support levels will be closely monitored on a daily closing basis. Given the recent surge in interest in the crypto sector, the uptrend may continue stronger following a limited correction.
Ethereum Continues Uptrend
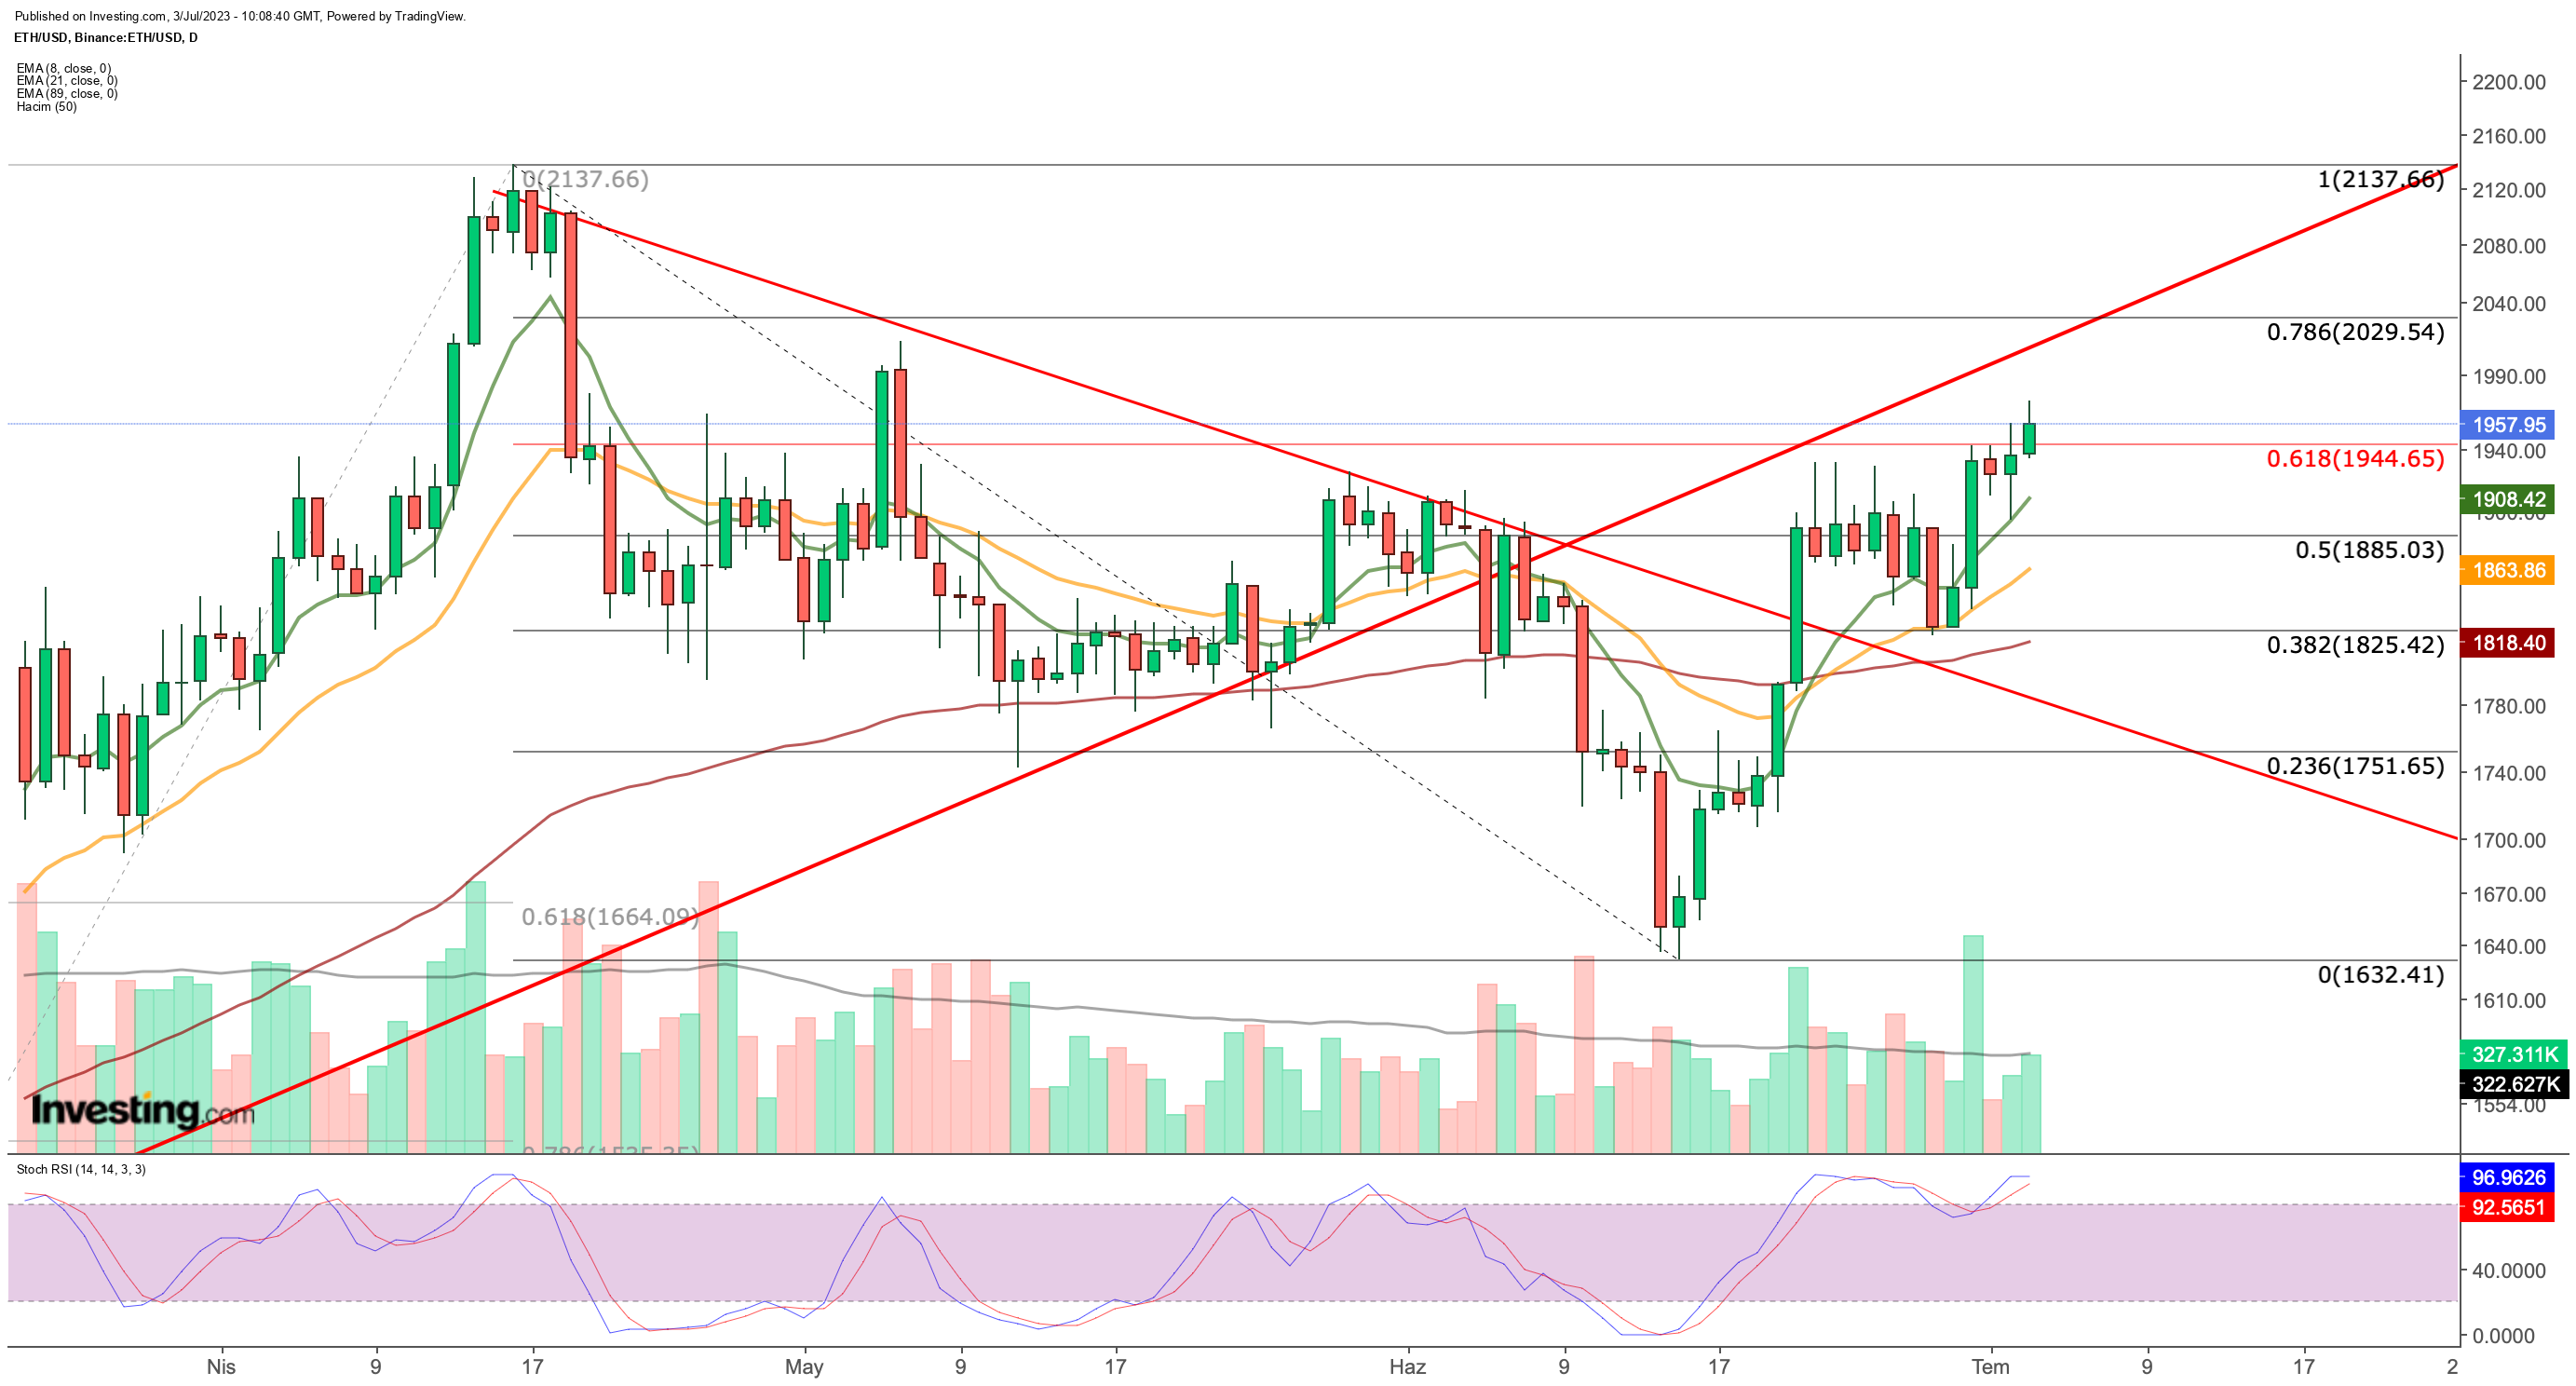
Moving on to Ethereum, it has been following a distinct trajectory from Bitcoin over the past two weeks. After being range-bound between $1,875 and $1,900 last week, Ethereum completed a limited correction by finding strong support in the lower region after briefly dipping to $1,820. Subsequently, it swiftly surpassed the psychological resistance zone at $1,900.

We continue to watch a retracement based on the period between April and June. Recently, Ethereum made an upward move to break the resistance at $1,945, corresponding to the 0.618 Fibonacci level in its recovery journey.
Although this level has been tested over the past three days, Ethereum has experienced a renewed surge in demand at the beginning of this week, indicating a return to support.
If Ethereum closes the day above $1,945 today, it will be a significant step towards reaching the $2,000 level this week.
However, it's important to note that Ethereum's performance could be influenced by any potential correction in Bitcoin, despite its recent distinct outlook.
A correction in Bitcoin could potentially disrupt Ethereum's upward momentum toward the $2,000 level. The closest support for Ethereum is at $1,945, while the $1,900 level just below it remains as the second support.
Additionally, in the event of a possible pullback in Ethereum, close attention will be paid to the Stochastic RSI indicator, as well as the price formation below the 8-day EMA value at $1,900.
If the indicator, which is currently moving horizontally in the overbought zone, falls below 80, it may trigger a correction phase.
InvestingPro assists savvy investors in analyzing stocks. By combining Wall Street analyst insights with comprehensive valuation models, investors can make informed decisions while maximizing their returns.
You can conveniently access a single-page view of complete and comprehensive information about different companies all in one place, saving you time and effort.
Start your InvestingPro free 7-day trial now!
Disclaimer: This article is written for informational purposes only; it is not intended to encourage the purchase of assets in any way, nor does it constitute a solicitation, offer, recommendation, advice, counseling, or suggestion to invest. We remind you that all assets are extremely risky and evaluated from different perspectives. Therefore the investment decision and the associated risk rests with the investor.

