Today's Analysis Of Weekly Bitcoin Chart
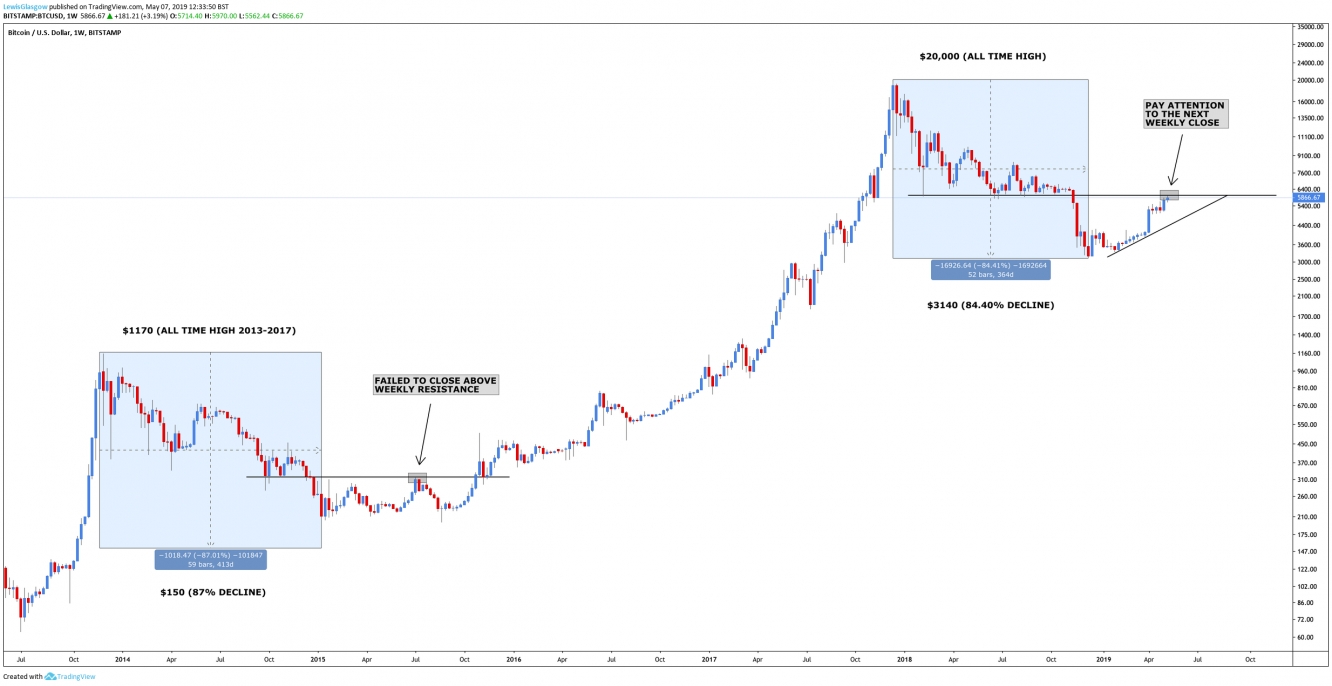
Today's Bitcoin analysis is a comparison between the current and previous bear market, there are a lot of similarities between both cycles that we can use to our advantage.
Firstly I'd like to address the overall decline in both market cycles.
- During 2013 to 2015, bitcoin dropped from $1170 to $150 resulting in a decline of 87% which lasted 413 days.
- During 2017 to 2019 bitcoin dropped from $20000 to $3140 resulting in a decline of 84.40% which lasted 364 days.
The percentage decrease and timespan are extremely similar in both cases.
The re-test of weekly resistance following the recent "market bottom" can be seen in both cycles.
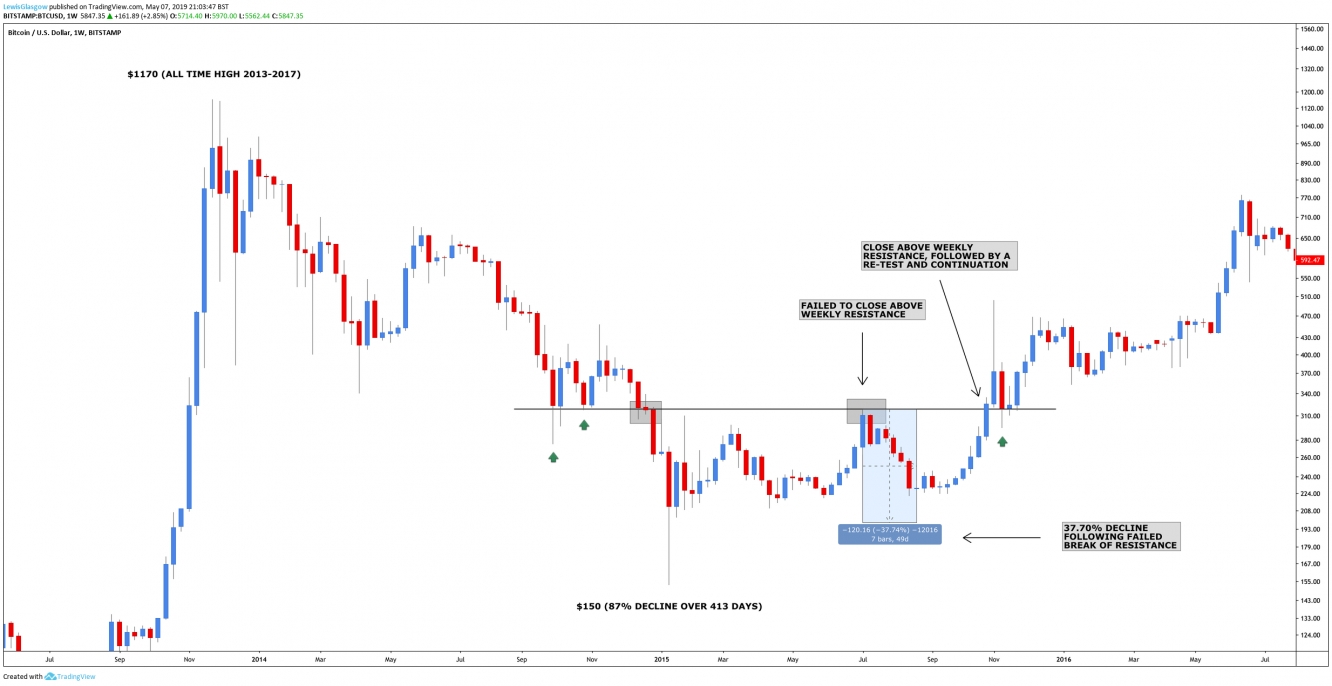
Let's take a look at the price action from 2015 to provide more detail on what I'm really looking at.
As you can see, this level held extremely well prior to price declining to $150, this support turned key resistance prevented a breakout during early July 2015, which was quickly followed up by a decline of 37.70% lasting 49 days. Only after this decline did price experience a breakout and continuation to the upside which resulted in a 2-year bull market and ultimately leading to the current all-time high of $20,000 after years of progression.
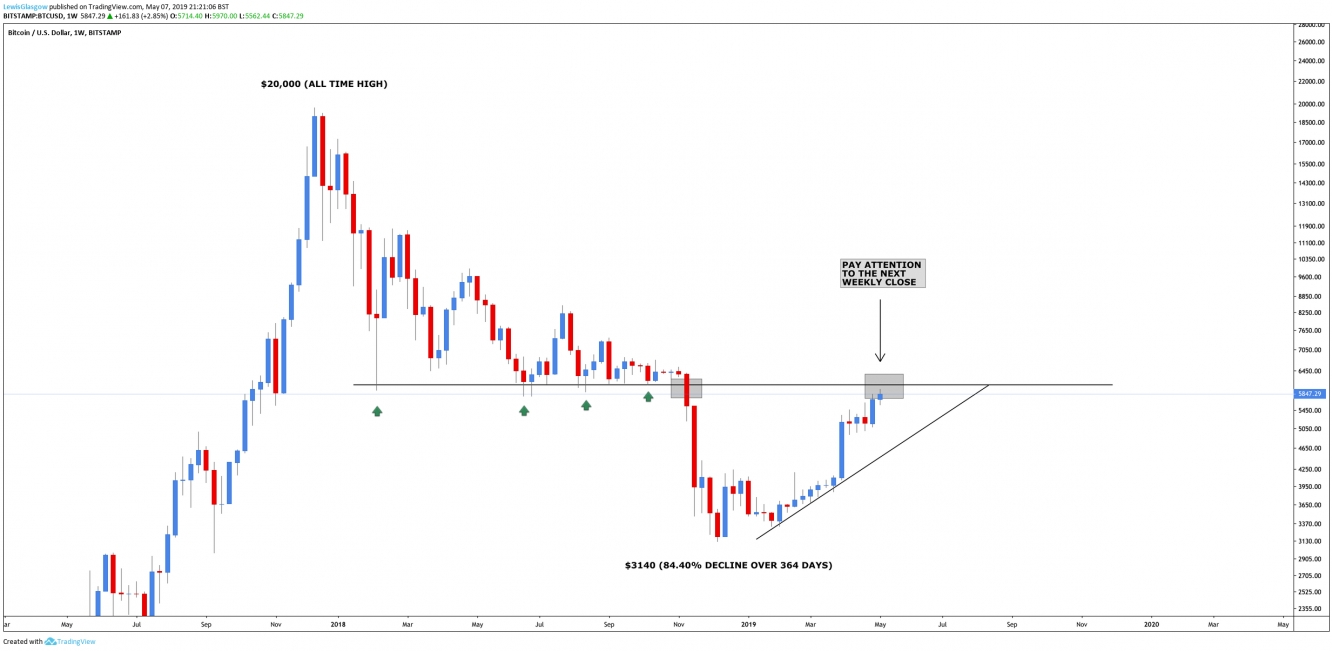
When we take a look at the current price action for bitcoin, it holds a similar structure.
The resistance bitcoin is now testing is much stronger than before, this support level held for 9 months with at least 5 separate tests in which it finally broke during November 2018. For anyone looking at bitcoin, I would pay close attention to the next few weekly candlesticks, mainly their closing prices and figure out what it is suggesting short-term.
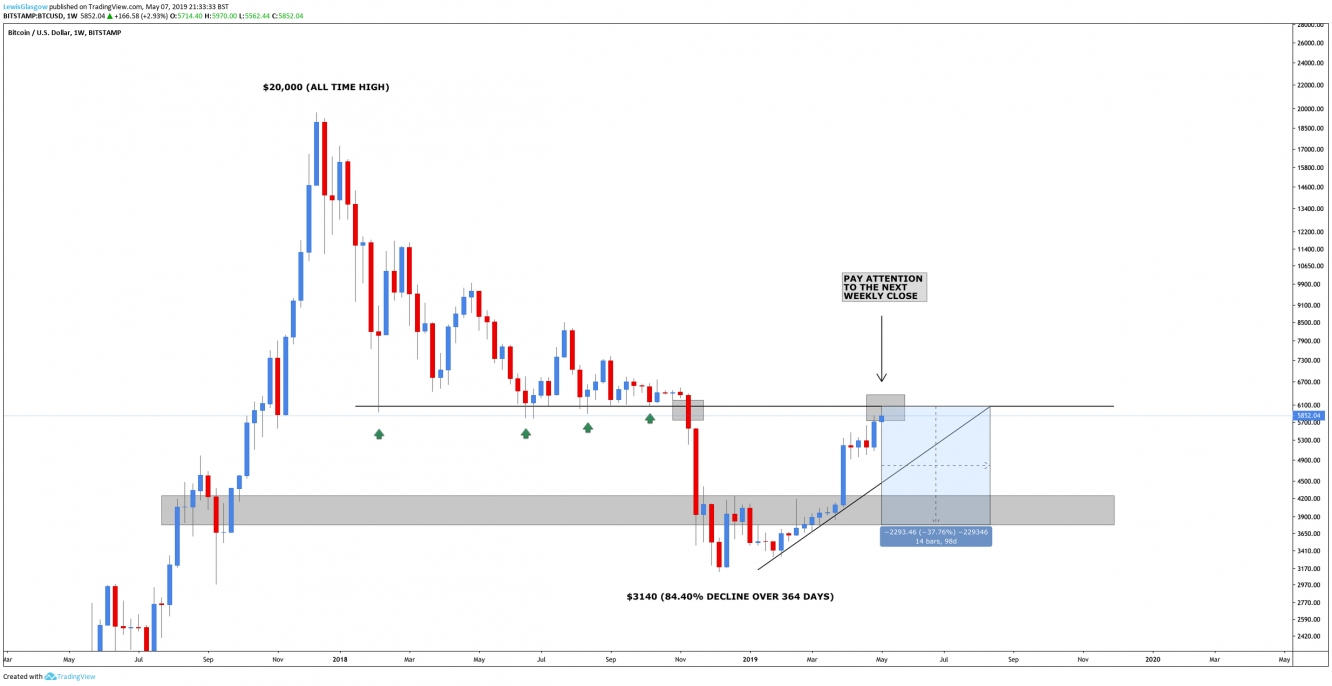
It is highly likely bitcoin will fall short at this weekly resistance level and history will repeat itself, the bulls will be put back in their place (for now) and we'll experience a minor correction either to the support trendline or a similar decline to the previous cycle, 37.70%?
A smaller correction to the trendline would result in a decline of 20% or less which is unlikely if a sell-off does happen it's likely it'll break that area and push further towards $4,000.
As mentioned this all depends on the price action in the following weeks.


