Hello traders!
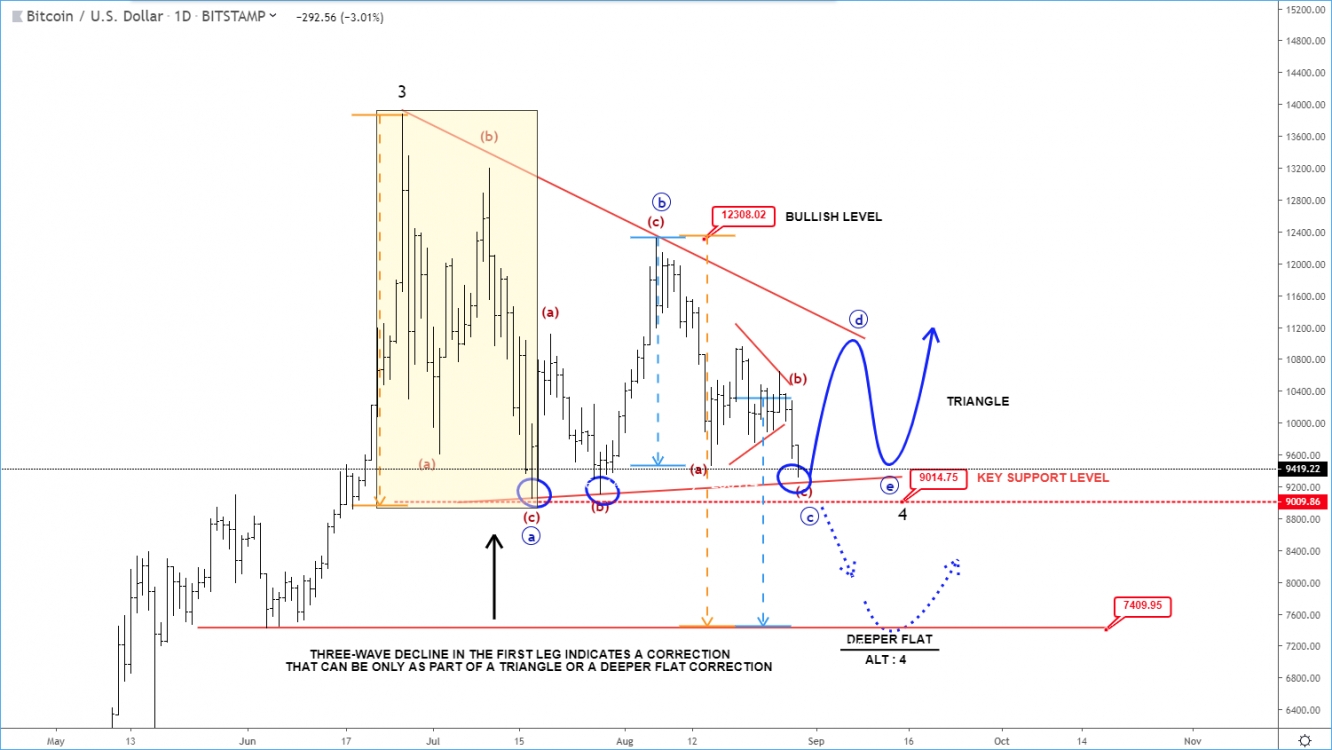
Bitcoin is trading at lows, so here is an educational chart with an explanation! Well, there's no assurance in the Crypto market, but the main reason we are tracking a bullish triangle om Bitcoin is that it's already retraced for 38,2%, which is the most commont retracement for wave 4 and also because of three waves of decline in the first leg. Some ALT coins hit new lows, some of them retraced for 61,8 - 78,6%, so it can be a perfect time for a reversal. But, we are not sure if there can be something even worse and there's a chance that BTC loses its dominance for a while in case if we see a deeper flat correction.
However, at this stage it's important to be patient. So, technically speaking, in case if we see a bounce in the Crypto market now at the beginning of September, then we may start considering a bullish triangle. But, if BTC/USD remains bearish and breaks below 9000 key support level, then be aware of a deeper flat correction that can send the price into 8000 – 7000 support area.

