
Summary
US fund managers and exchanges are rapidly developing products to tap into the fever surrounding digital and crypto assets.
Investment capital continues to flood into Bitcoin.
GBTC provides an excellent vehicle to take advantage of Bitcoin’s volatility but without the margin risks of a futures contract, yet still falling within the realm of well-regulated instruments.
It looks like the Bitcoin phenomenon is not going away any time soon. If anything, it continues to spread. According to Reuters, US fund managers are ramping up efforts to tap into the fever surrounding digital assets. The latest planned Bitcoin products could deliver some head-turning and stomach-turning price movements if they come to the market.
One new idea is to build leverage and inverse funds that would rise or fall twice as fast as the price of Bitcoin on a given day. Direxion Asset Management LLC plans to list such products on the Intercontinental Exchange (NYSE Arca exchange), if US securities regulators give the nod according to a filing by the exchange this week. In the filing, the exchange said, the listing “will enhance competition among market participants to the benefit of investors in the marketplace.”
Bitcoin: A Trader’s Dream
Bitcoin is a virtual asset that can be used to move money around the world quickly, with relative anonymity, and without the need for a central authority or bank. It is one of the wildest trades in the market today delivering sharp profits that defy explanation.
On the other hand, this is a trader’s dream come true. One of the major ingredients traders look for is volatility. For us, this is a tremendous opportunity to implement the reversion to the mean strategies we have been applying to the precious metals markets since 2012. The Variable Changing Price Momentum Indicator (VC PMI) algorithm is based on a momentum indicator and reversion to the mean. The VC PMI identifies the trigger signal when the price crosses certain points. Then, depending on where you are relative to the range, the VC PMI produces a structure for you automatically of five different levels: the average price and two levels of extreme above the mean, and two levels of extreme below the mean. With this trading structure, you can then intelligently execute trades.
One of the key elements of reversion to the mean that makes it successful is that it is based on historical data points. The market has a tendency to identify an average price: the mean or equilibrium. Using the 9-year cycle, we have taken the mean price for the gold market to be around the $1270 area, which also matches the 18-year cycle. With the market coming down to these extremes, the market and the VC PMI has produced phenomenal results, as shown in our reports I have published on Seeking Alpha.
The crypto arena provides the VC PMI with a very good friend: volatility. With the application of the VC PMI to Bitcoin, we are getting very accurate and executable signals. Depending on the type of trader you are (day, swing or position trader), you can identify the average price and, based on the structure the VC PMI provides, trade intelligently.
An Alternative to Bitcoin Futures: GBTC
Given the volatility that Bitcoin is exhibiting in the futures market, we are finding that many of our clients don’t know how, or are hesitant to, to take advantage of this crypto opportunity. We have found an instrument that you can trade it without the margin risk of a futures contract: the NYSE’s Bitcoin Investment Trust (OTCQX:GBTC).
The Bitcoin Investment Trust’s shares are the first publicly quoted securities solely invested in and deriving value from the price of bitcoin. The BIT enables investors to gain exposure to the price movement of bitcoin through a traditional investment vehicle, without the challenges of buying, storing, and safekeeping bitcoins. Publicly quoted on OTCQX® under the Alternative Reporting Standards
GBTC started trading on May 4, 2015. On March 20, 2017 the index was trading at a low of $104, and since then we have seen an explosive move that brought the price to the high that was established on December 18, 2017 of $3523. When you take a look at this astonishing move, it has significantly outperformed almost all conventional investments, particularly investments that are at a suppressed level based on the central bank manipulation that has taken place, such as in precious metals, interest rates and bonds.

The Traditional Banking System’s Failure: Bitcoin
What I see here is that the tremendous amount of pressure from investment capital that is on the sidelines is a strong indication that the central banking system’s monetary policies have failed and that the system is changing rather quickly. Obviously this kind of growth is causing a serious level of concern for regulators and banking institutions that still have no way to control the phenomenon, which is completely outside the central banking system. So they are scrambling to quickly create products that are within their regulatory realm to mirror the actual cash price of Bitcoin.
The price of Bitcoin or Bitcoin cash is actually the cash market. What is unusual is that the cash market as we know it in the regulated market is where the physicals are exchanged, but it is still within the structure of traditional regulation. For example, gold was regulated by the London Exchange, and the London fix was what dictated the price of cash gold, which was what usually dictated the price of the futures contract. This was in a free-market environment until the central banks decided to take control of the price of precious metals and manipulate it by creating a tremendous number of artificial short positions. They created so many short positions that it is impossible to deliver on the contracts if the contracts were called in. The amount of leverage that was used was (and is) completely artificial, and this is the way the central banks were able to control the price. When they can sell into a market 10 or 15 times worth of contracts compared to what is produced physically of that asset, such as in gold and silver, the market is completely manipulated. Governments gave central banks and major institutional investors, such as JP Morgan, an unlimited amount of money via extremely artificially low interest rates to hedge their positions. Although they were manipulating the price of gold and silver, they were actually manipulating the US dollar in an attempt to prop it up as the global reserve currency.
The problem for central bankers today is that the cat is out of the bag. The amount of money that is moving into the crypto area is staggering; over $30 billion into that sector already. Central bankers cannot control Bitcoin as capital seeks higher returns than central bankers were allowing by suppressing the price of gold and silver, while keeping interest rates artificially low.
The Variable Changing Price Momentum Indicator
I do want to warn you that the volatility we are experiencing is just the beginning. If you want to become involved, make sure you do your research, have a plan, and an asset structure in place or some kind of systematic or algorithmic approach to the marketplace.
I use the VC PMI automated algorithm to identify the average price for the following day, week and month. Once I identify the average price, the VC PMI creates a structure above and below the mean of supply and demand levels above and below the market. The distance between that supply and demand is the implied volatility. It shows the extremes that the market will mathematically reach for that trading period, whether daily, weekly or monthly. The VC PMI has a greater than 90% probability that if prices reach those extreme levels, the market will revert back to the mean, and in some cases to the extreme below the mean.
GBTC: Bullish
Let’s take a look at the weekly demand and supply levels for GBTC for next week to take advantage of the tremendous volatility that we are seeing. The first filter that we use to identify the trend momentum is the 9-day moving average, which for next week is $1690. The market closed Friday at $2337, closing above the mean, which gives us a bullish indication coming into next week.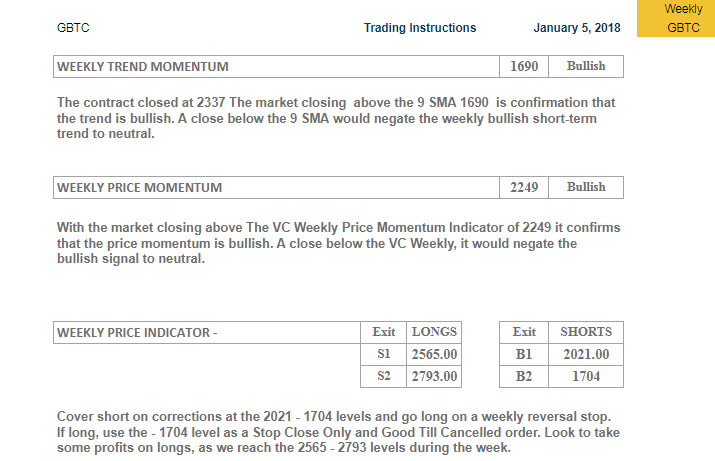
The alternative the VC PMI provides is that if the price closes below $1690, this action would negate the weekly bullish short-term trend. You can use this level as a protective stop to either reduce your position or go neutral.
The second filter that we use is the weekly price momentum, which according to the VC PMI is $2249. Because the price closed above $2249 on Friday, the market has given us a very bullish indication that as we come into next week that prices could move higher. It also tells us that if the market comes down to $2249, then this bullish pattern will be negated. The $2249 level also provides a secondary stop level to manage your position.
Because the market is coming in bullish next week, this is a point where we could we take some profits off the table. Based on the extreme above the mean of what we call sell 1, the VC PMI recommends taking profits at $2565, if you have multiple positions. The sell 2 level is $2793, which is where you can take more profits. You can also trail your stop at either level.
If the market closes below $2249, it would negate the bullish weekly uptrend, and you should cover any bearish position as we go down to $2021 and $1704. If the market goes down to those levels, it activates a long signal and you should go long. You would then place a stop at $1704 automatically. If you go long at $2021, look at the pivot point above that, which is $2249, the weekly average price, as a point to take some profits.
Know Thyself
I produce these numbers based on our metrics, but it is impossible to implement money management within the VC PMI algorithm, because that depends on the situation and personality of each individual trader, in large part depending on the size of their trading portfolio. The first thing to identify to become a successful trader is to realize what size jacket you need to wear to trade. Know the right size for you, so you can find a comfort level to trade intelligently and not trade with a burden based on unrealistic expectations weighing you down.
Conclusion
We are getting a rush of derivatives and future contracts tied to Bitcoin in the regulated arena. They are going to provide a tremendous opportunity for traders who have reservations trading the actual crypto market, which can be complicated and highly risky. At least by trading regulated instruments, such as GBTC or Bitcoin futures, you are dealing with a formal and more regulated environment that can provide a more defined structure for the price action. It will be interesting to see moving forward how the cash market relates to the futures market. As volume increases, I think we’ll be able to find over the long haul an equilibrium price and we can function on a more consistent pricing level of supply and demand for Bitcoin.
*Disclaimer: The information in the Market Commentaries was obtained from sources believed to be reliable, but we do not guarantee its accuracy. Neither the information nor any opinion expressed herein constitutes a solicitation of the purchase or sale of any futures or options contracts. This report is for educational purposes only.