Bitcoin Technical Analysis | 27 June 2018
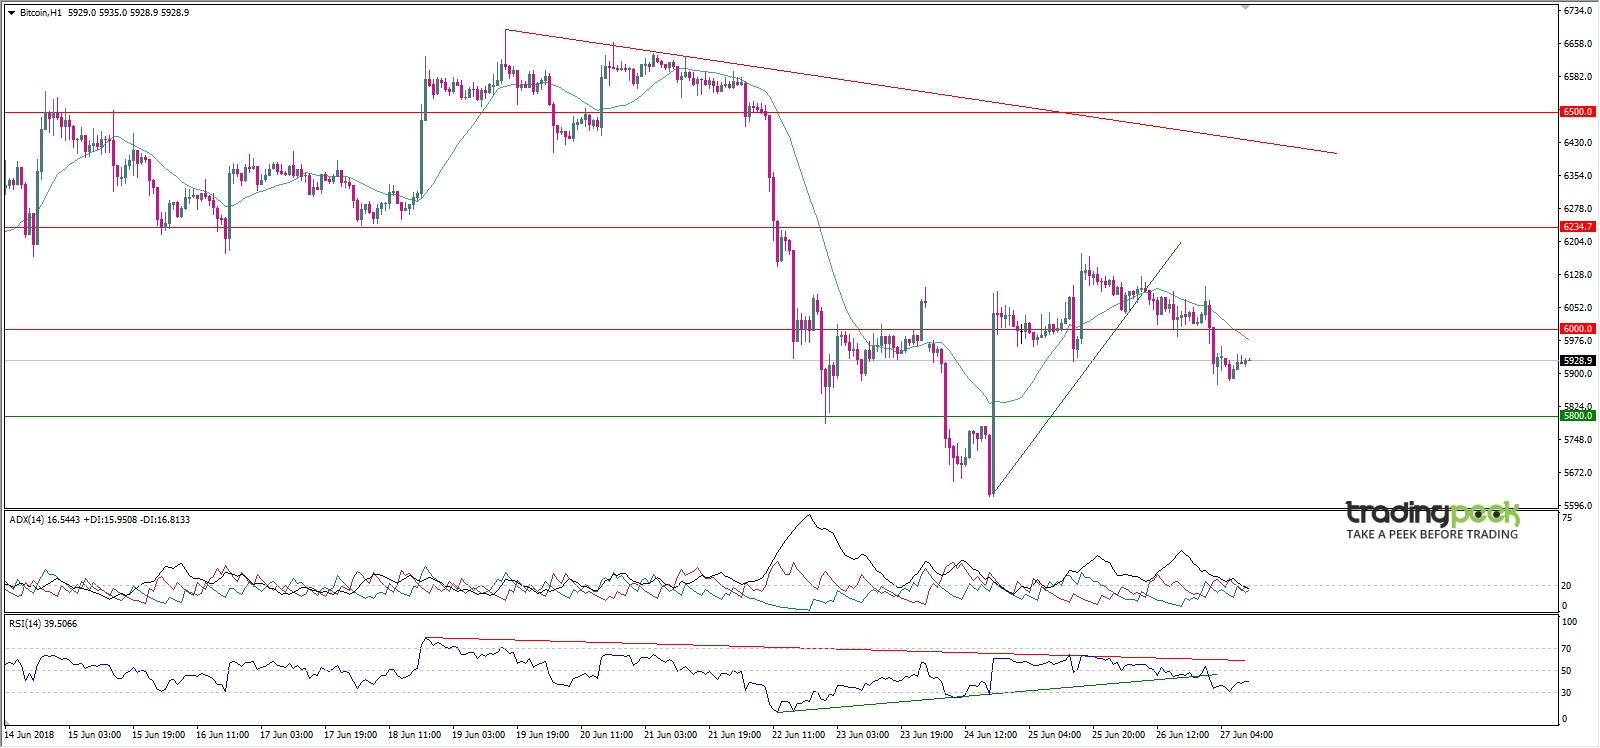
Bitcoin (BTC) broke the rising trend line during morning trading, and during today's trading the support area was breached at $ 6000 due to bear pressure.

The digital currency is trading in a bearish direction on the hourly interval as sellers press on the encrypted currency, and we do not recommend selling until the $ 5874 area is broken.
The SMA 20 is bearish.
Momentum RSI 14 is trading in a bearish direction supported by breaking the ascending trend line during morning trading.
Outlook:It is expected that, in the case of breaking the digital currency of the Bitcoin $ 5874 areas, the area may target $ 5617.
On the other hand in the case, the digital currency breakout of the $ 6100 Bitcoin areas may target $ 6405.
Support: 5800-5500- 5250
Resistance: 6000 - 6234 - 6500
Trend: Up
Ethereum Technical Analysis | 27 June 2018
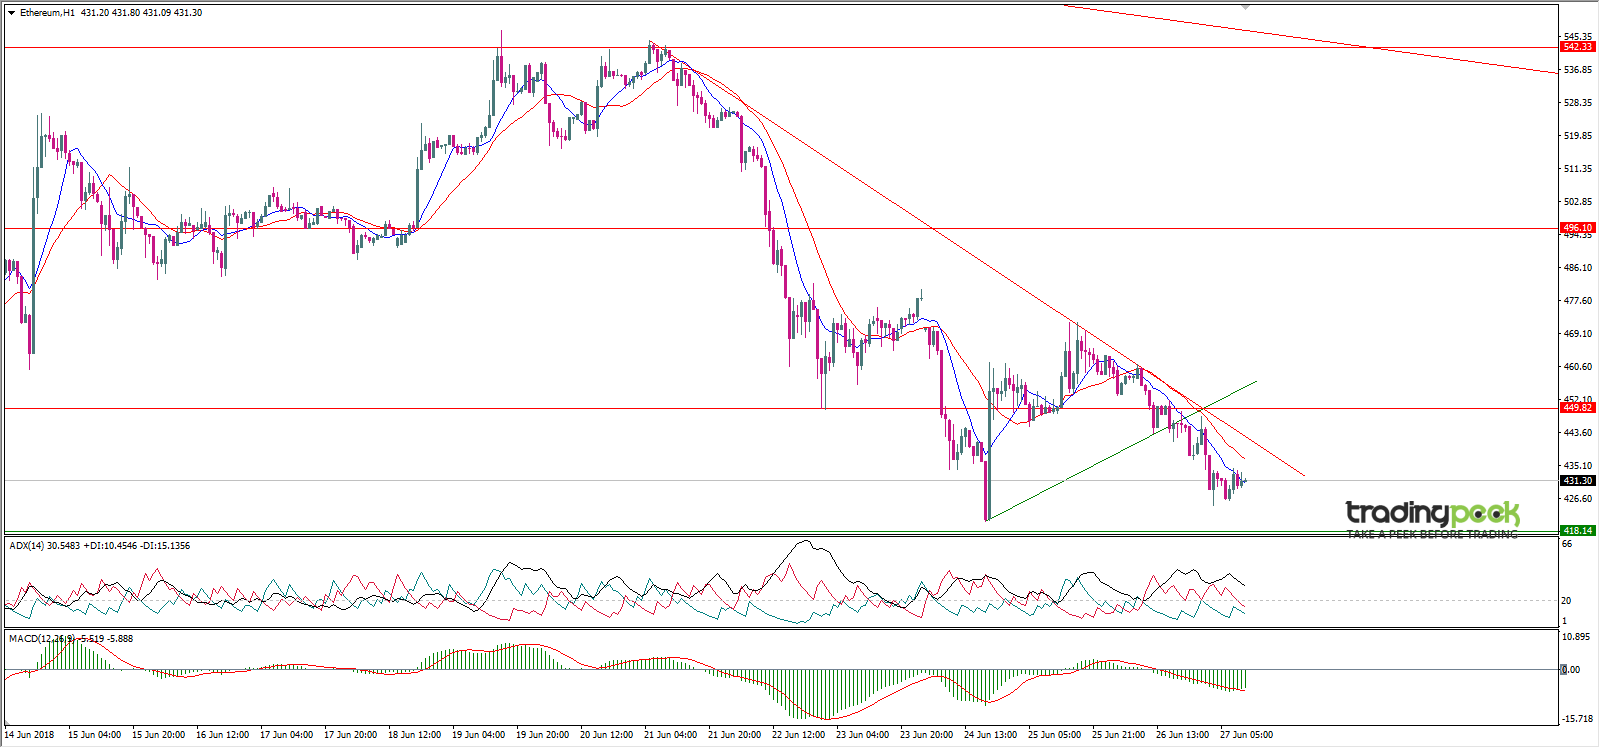
Ethereum (ETH) broke the support area of $ 449.82 during yesterday's trading which led to the break of the rising trend line and the currency continued to fall until the areas of 425 $.

Ethereum trades in a bearish direction on the hourly interval.
The simple moving average and the slow moving average are pointing downward.
The MACD of the regular setting is neutral, as a result of the lack of confirmation of the positive cross between its index.
Outlook:It is expected that, in the case of breaking the digital currency ethereum areas $ 425.01 the currency may target $ 418.14.
While, in the case of a digital currency break the ethereum area $ 435.00 may target the $ 450.00 area.
Support: 418.14- 387.47- 360.34
Resistance: 449.82 - 496.10 - 542.33
Trend: Down
Ripple Technical Analysis | 27 June 2018
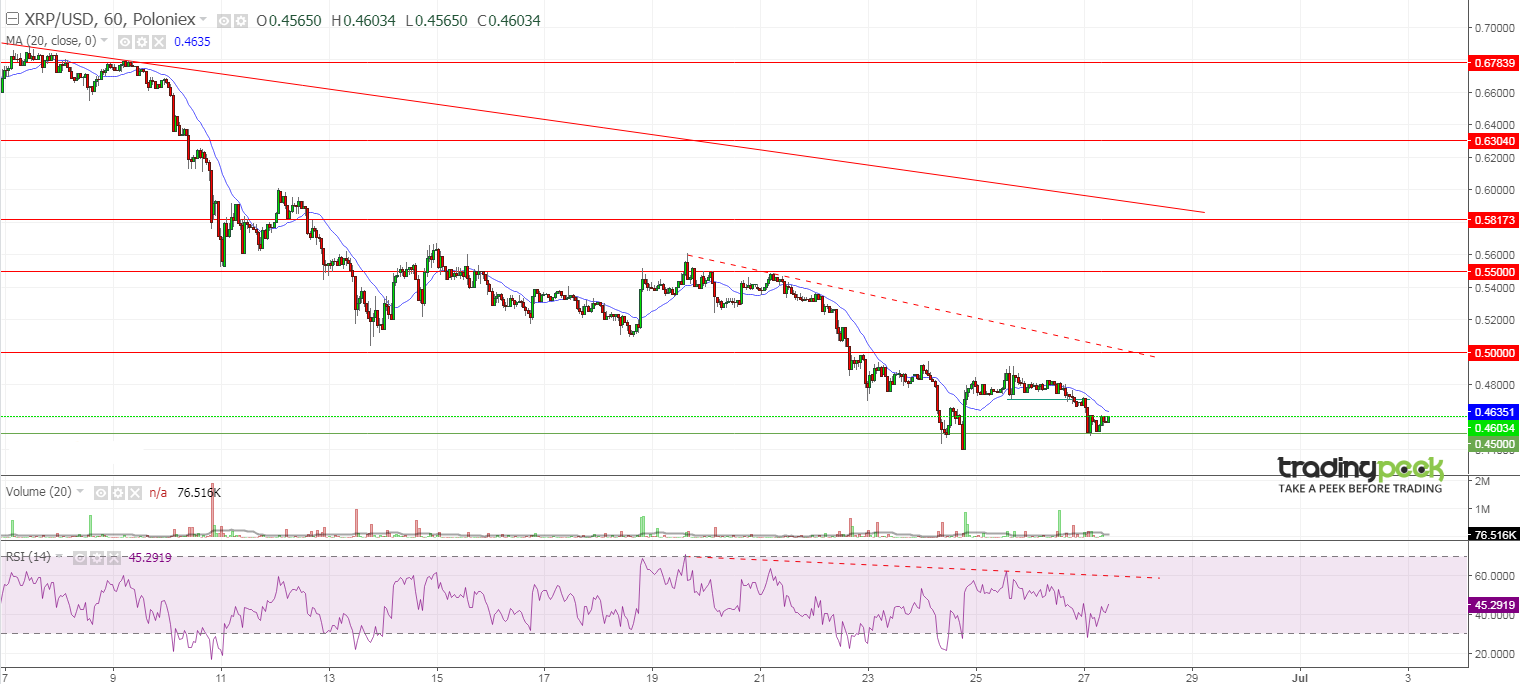
Ripple (XRP) broke the 0.4709 area during yesterday's trading and continued to fall as far as $ 0.45.

The digital currency is trading in a bearish direction over the hourly interval, and we do not recommend selling until the $ 0.45 area is broken.
The SMA 20 is bearish.
Momentum RSI 14 is trading in a bearish direction in the configuration.
Outlook:It is expected that, in the event of a break of the $ 0.45 digital currency, Ripple may target $ 0.4250.
While, in the case of a break of the digital currency the 0.4915 region's Ripple may target $ 0.5315
Support: 0.45- 0.4- 0.35
Resistance: 0.5- 0.55- 0.5817
Trend: Down
Bitcoin Cash Technical Analysis | 27 June 2018
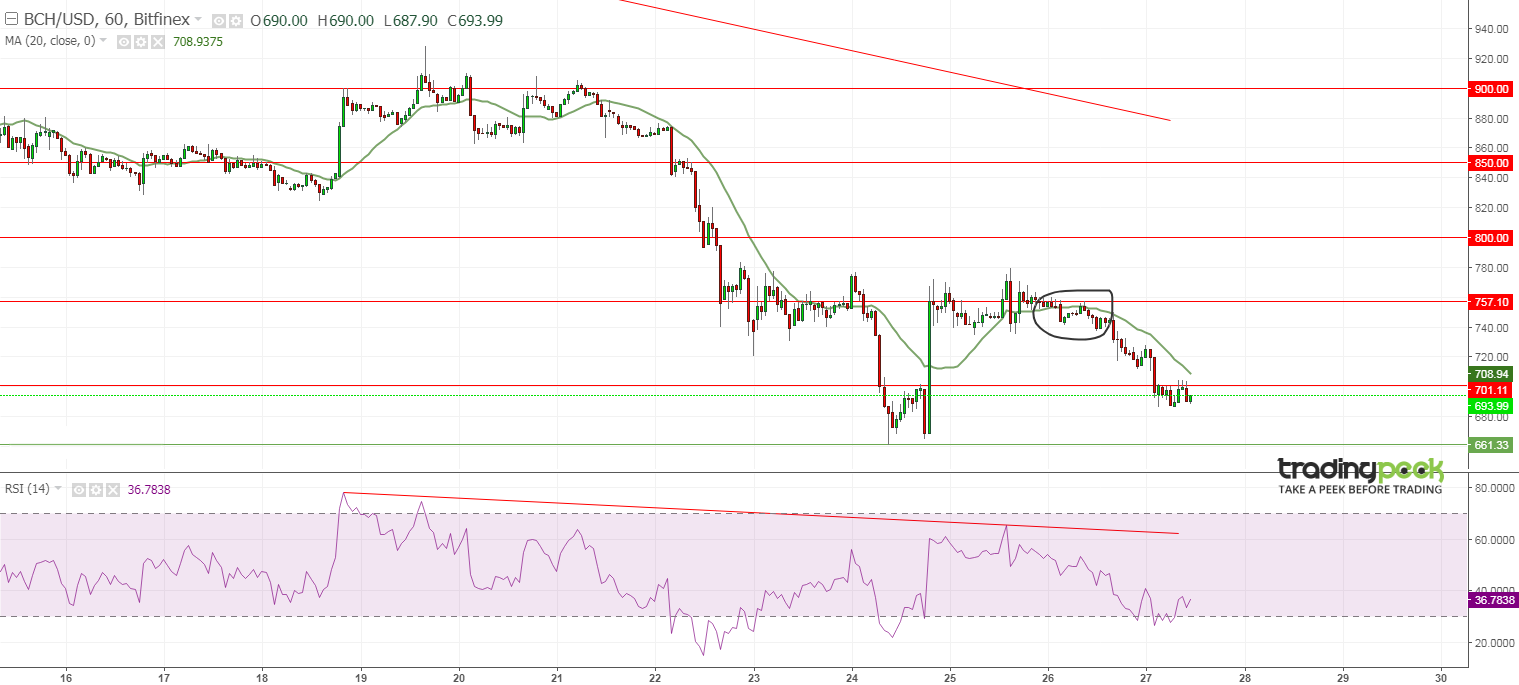
Bitcoin Cash (BCH) failed to break through the $ 757.10 resistance zone on the hourly interval during yesterday's trading as a result of sellers' pressure on the currency.

Bitcoin Cash is trading in a bearish direction supported by a break of $ 701.11.
The SMA 20 is bearish
Momentum Relative Strength 14 is currently trading in a bearish direction.
Outlook:It is expected that, in the event of a break of the digital currency Bitcoin Cash area $ 686.8 USD may target the currency area $ 661.33.
While, in the case of a breach of the digital currency Bitcoin Cash area $ 705.00 the currency may target $ 750.0.
Support: 661.33-631.72-6.00.00
Resistance: 701.11 - 757.10 - 800.00
Trend: Down
